competitive analysis graph, SEO competitive analysis, AI search visibility, share of voice, perceptual map
Competitive Analysis Graph: Design and Read It
Written by LLMrefs Team • Last updated November 1, 2026
In 75% of industries, business units moved through the growth-share matrix faster when BCG compared 2008–2012 with 1988–1992, according to BCG's reassessment of its classic framework. A competitive position isn't a permanent address. A graph that looked decisive at the last positioning review may no longer describe the market you're competing in.
A competitive analysis graph plots competitors against defined measures so a team can make a specific decision. For SEO teams, that means looking beyond a neat leaderboard: separating being mentioned from being cited, checking which answer engine produced the result, and showing how much confidence the sample deserves. The useful question isn't who sits highest, but what each dot is allowed to claim.
Graph Templates and the Axes to Plot
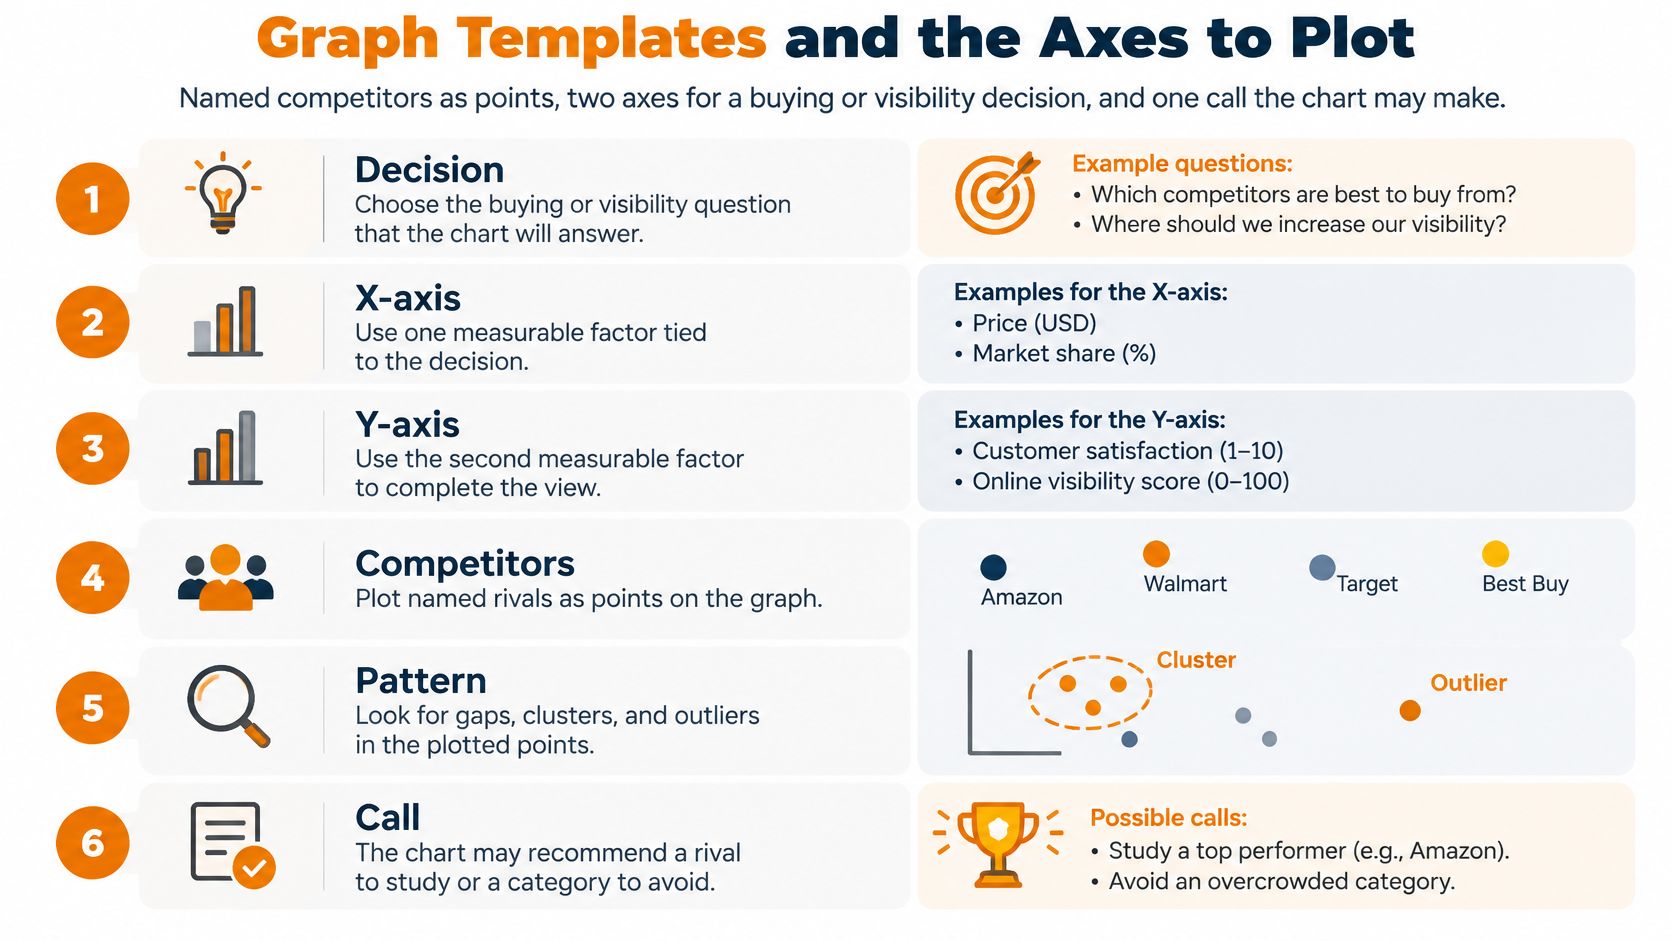
Sketch named competitors as points, give each axis a measurable definition, and write the decision beside the chart. For an SEO team, the most useful default is traditional ranking visibility across the horizontal axis and AI citation visibility up the vertical axis. That layout makes a practical distinction between appearing in search results and supplying evidence for an answer.
An Ahrefs analysis of 1.9 million citations from approximately 1 million Google AI Overviews found that 76.10% of cited pages ranked in the traditional top 10, 9.50% ranked between positions 11 and 100, and 14.40% didn't rank within the top 100. Conventional rankings and answer citations overlap, but they're not interchangeable.
Choose the chart by the decision
Competitive analysis graph templates
| Graph | Horizontal axis | Vertical axis | Decision it forces |
|---|---|---|---|
| Positioning map | Price or a key attribute | Perceived quality or a second attribute | Where you sit versus the buyer ideal point |
| Growth-share quadrant | Relative share of voice or market share | Category growth or visibility momentum | Invest, hold, or exit |
| Rank versus AI citation | Traditional top-10 coverage | AI citation rate | Who wins answers without winning blue links |
| Mention versus citation | Brand mention share | Citation or source share | Named in the answer versus used as evidence |
| Source footprint | Mention rate | Count of distinct third-party domains | Outreach gaps versus owned pages only |
| Cohort time series | Week or month | Share of voice or average answer position | Persistent lead versus one-run noise |
A positioning map answers a buyer-perception question. Plot price against perceived quality, for example, and mark the combination buyers prefer as an ideal point. The Varsity Tutors explanation of perceptual maps describes the underlying logic: perceived similarity becomes proximity, so nearby brands represent similar positions rather than necessarily similar sales.
A growth-share quadrant answers a resource-allocation question. A high-share competitor in a fast-growing category occupies the star position; a high-share competitor in a flat category resembles a cash cow. If you substitute visibility momentum for market growth, label the adaptation clearly. AI share of voice isn't market share.
Keep the measurement separate from the interpretation
On the rank-versus-citation chart, a rival with weak organic coverage but strong citations deserves investigation. Strong rankings with rare citations suggest reviewing whether the ranking pages answer conversational questions directly, not assuming another ranking push will solve the gap.
The mention-versus-citation chart separates a brand named in an answer from a domain used as evidence. The source-footprint chart compares how frequently a brand appears with the breadth of external domains supporting it. Use the cohort time series when the decision depends on persistence rather than position.
For help choosing relevant competitor attributes before plotting, NZ Apps' guide to competitor research provides a useful starting point for the comparison criteria.
Practical rule: Lock the template before exporting the results. Don't blend being named and being used as evidence into a score that hides both.
How to Build the Graph from a Stable Cohort
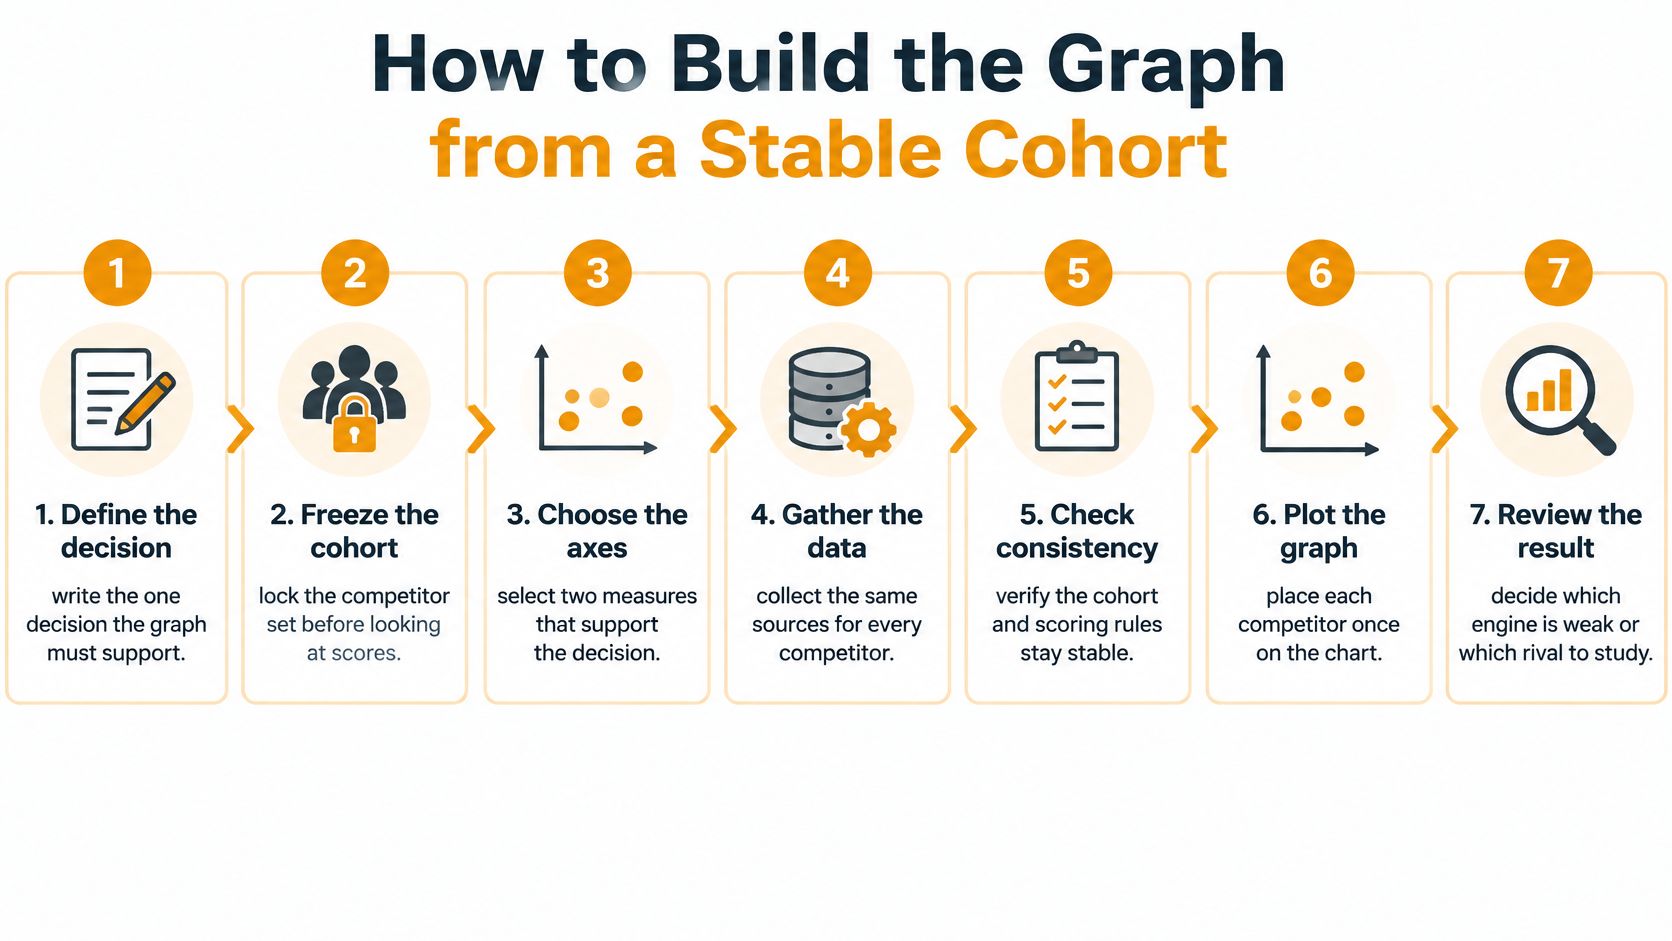
A cohort is the fixed collection of keywords, prompt variants, competitors, markets, and answer engines you compare. Freezing that collection prevents an analyst from accidentally changing the contest after seeing who's winning. A spreadsheet, a plotting tool, and an answer-monitoring platform can support the workflow, provided they preserve the same definitions.
Set the rules before collecting answers
Write the decision. Choose a question narrow enough to answer with the graph, such as which rival deserves source-level investigation or which engine needs attention. Don't start with a general request to show the competitive field, because almost any chart could satisfy it without changing a decision.
Freeze the cohort. As a hypothetical agency setup, use 200 product-category keywords, each with several natural-language variations, for a single country and language. Lock the competitor list too, including aliases and product names that should count toward each brand. For a local-service comparison, competitor analysis for UK trades from Growth 4 Trades provides relevant context for defining a commercially meaningful rival set.
Define the metrics. Write the numerator and denominator beside every rate. Define mention rate as eligible answers naming a brand divided by eligible answers observed; define mention share as that brand's counted mentions divided by all tracked-brand mentions. For citation share, specify whether you're counting citation occurrences, cited pages, or cited domains, then keep that unit consistent. Define answer position, distinct external domains, and traditional top-10 coverage separately, including how missing results are handled.
Collect repeated observations. The Princeton GEO benchmark, referenced in this large-scale generative-engine study, tested content changes across 10,000 queries. The operational lesson isn't that every team needs that exact sample, but that isolated answers aren't an adequate benchmark. LLMrefs is one collection option: set keywords, generate conversation-style prompts, and collect mentions, citations, positions, recurring updates, and statistical-significance checks.
Make the chart reproducible
Normalize before plotting. Convert counts into rates or shares using the predefined denominator so a broader category doesn't automatically look more successful. Decide whether each keyword receives equal weight or each generated prompt does. If some keywords have more variations, that choice can change the result.
Plot and annotate. Place each brand once on the selected scatterplot, label it directly, and attach the observation count, country, language, engine, and measurement window. Set each quadrant cut at the cohort median, record the resulting values, and explain that high and low mean relative to this cohort, not an external performance standard.
Save the frame. Store the keyword list, prompt variants, competitor aliases, formulas, exclusion rules, and quadrant cuts with the export. Reuse that frame for the next run rather than updating it without noting the change after inspecting the scores. A changed cohort should become a new comparison series.
A useful handoff includes both the plotted values and the observations behind them. Keep failed requests distinct from valid answers that didn't mention a brand; treating both as absence can distort the rate.
The competitor analysis research workflow is a useful companion when organizing the evidence behind the chart. Done means another analyst can rebuild the graph from the export without guessing a formula, choosing a new denominator, or reconstructing what counted as a competitor.
False Precision and Unstable Scores
Did the rival improve, or did the sample move? A polished leaderboard should be able to answer that question before anyone treats a change in rank as progress. Decimal places don't resolve an inconsistent cohort.
Signals that look decisive and the check they need
| Signal | Looks like | Check before you act |
|---|---|---|
| Aggregated rank | Leadership across AI search | Inspect the engine split |
| Mention share | Strength as a cited source | Compare mentioned brands with cited domains |
| Week-to-week jump | A competitor gained | Check sample size, prompt coverage, and a significance flag |
| One blended score | A single competitive position | Separate mention share, citation share, country, and language |
Diagnose the impressive number
Across 24,067 prompts on Google AI Overviews, ChatGPT, Gemini, Claude, and Perplexity, only 8% of recommended brands appeared across all five engines and 54% appeared in only one, according to the analysis discussed by The Drum. The same article describes a 2026 analysis covering 22 categories, measured monthly in the US and UK, that found only 36.7%–45.3% overlap between the top 100 brands mentioned and the top 100 domains cited.
Those comparisons expose different problems. Aggregation can conceal an engine-specific absence, while a mention score can be mistaken for evidence that a brand's website supplied the answer. Keep engine results as separate series or small multiples, and make brand-level and domain-level measures visibly different.
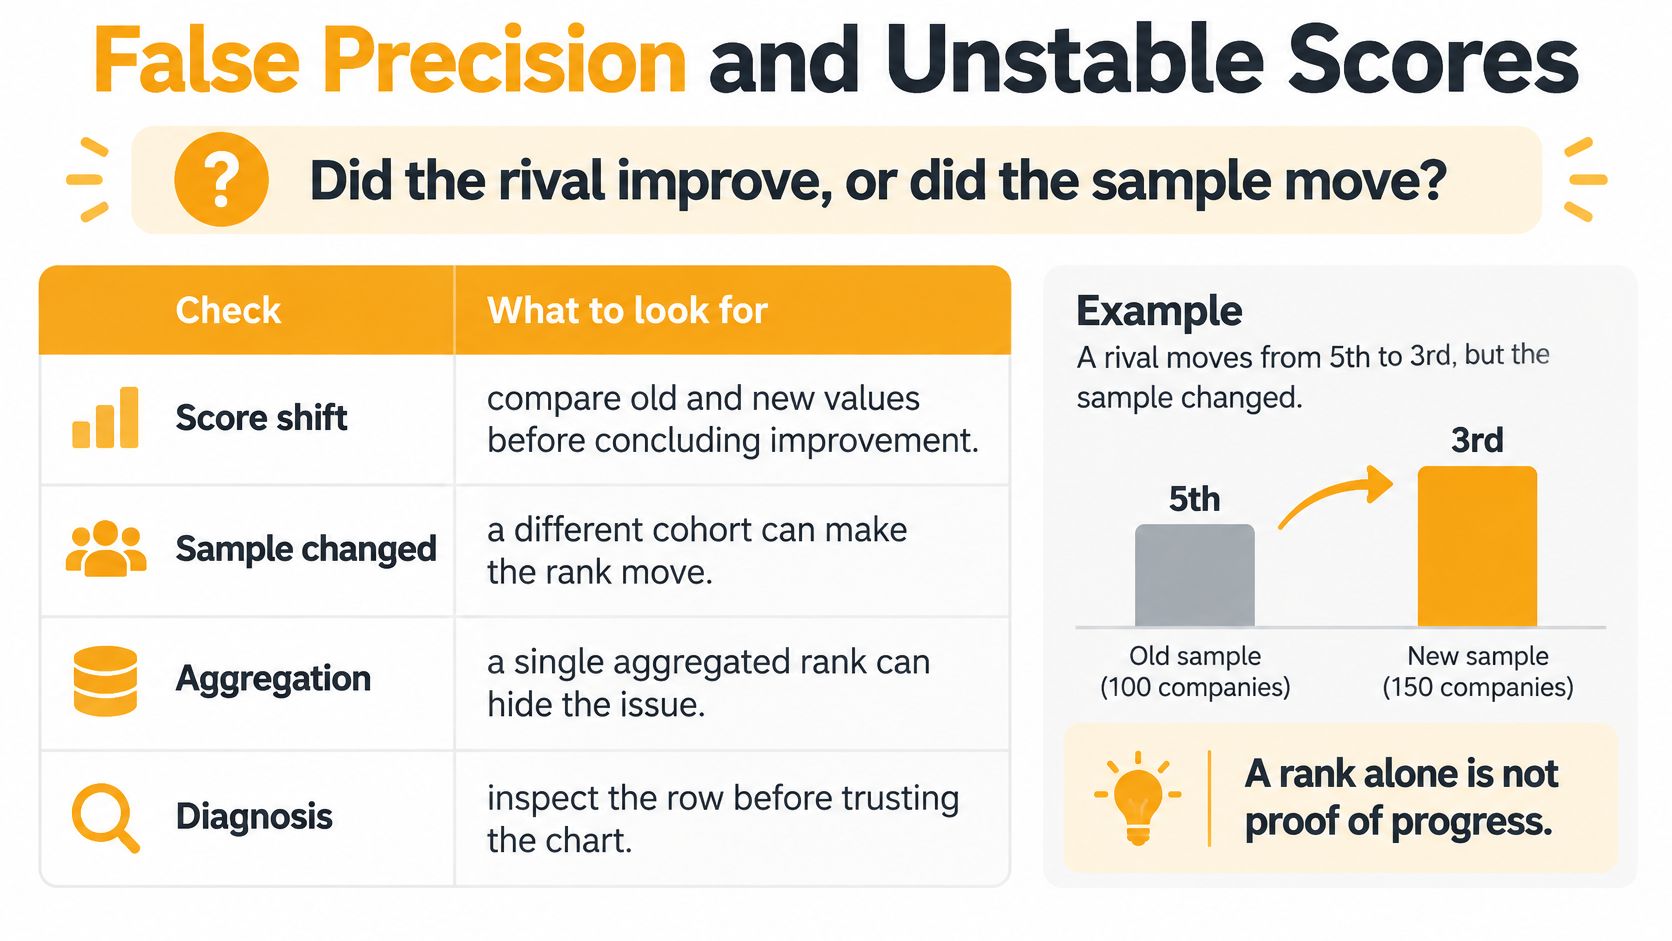
A weekly jump needs another diagnosis. Check whether the same buying questions were covered, whether failed observations changed the denominator, and whether more repetitions came from a particularly favorable prompt family. Repeated wording variations aren't automatically independent evidence.
Country and language cuts deserve the same scrutiny. If a brand gains in one market while losing in another, an overall score can hide the change that matters to the team responsible for a specific market.
Show uncertainty without decorating it
Use a confidence interval only when you can explain how it was calculated. For repeated prompt observations, a sensible approach is to resample at the keyword or prompt-family level rather than pretending every closely related answer is independent. If the sample doesn't support a defensible interval, display an unstable label and describe the coverage gap.
A significance flag should identify the comparison and method, not act as an unexplained green badge. Add a stability note when rankings reverse across repeated runs.
A competitor analysis matrix can hold those diagnostic fields beside the graph. For the next budget meeting, enforce a simple condition: no allocation decision from a graph that can't show its engine and sample size.
How to Read Positions and Gaps
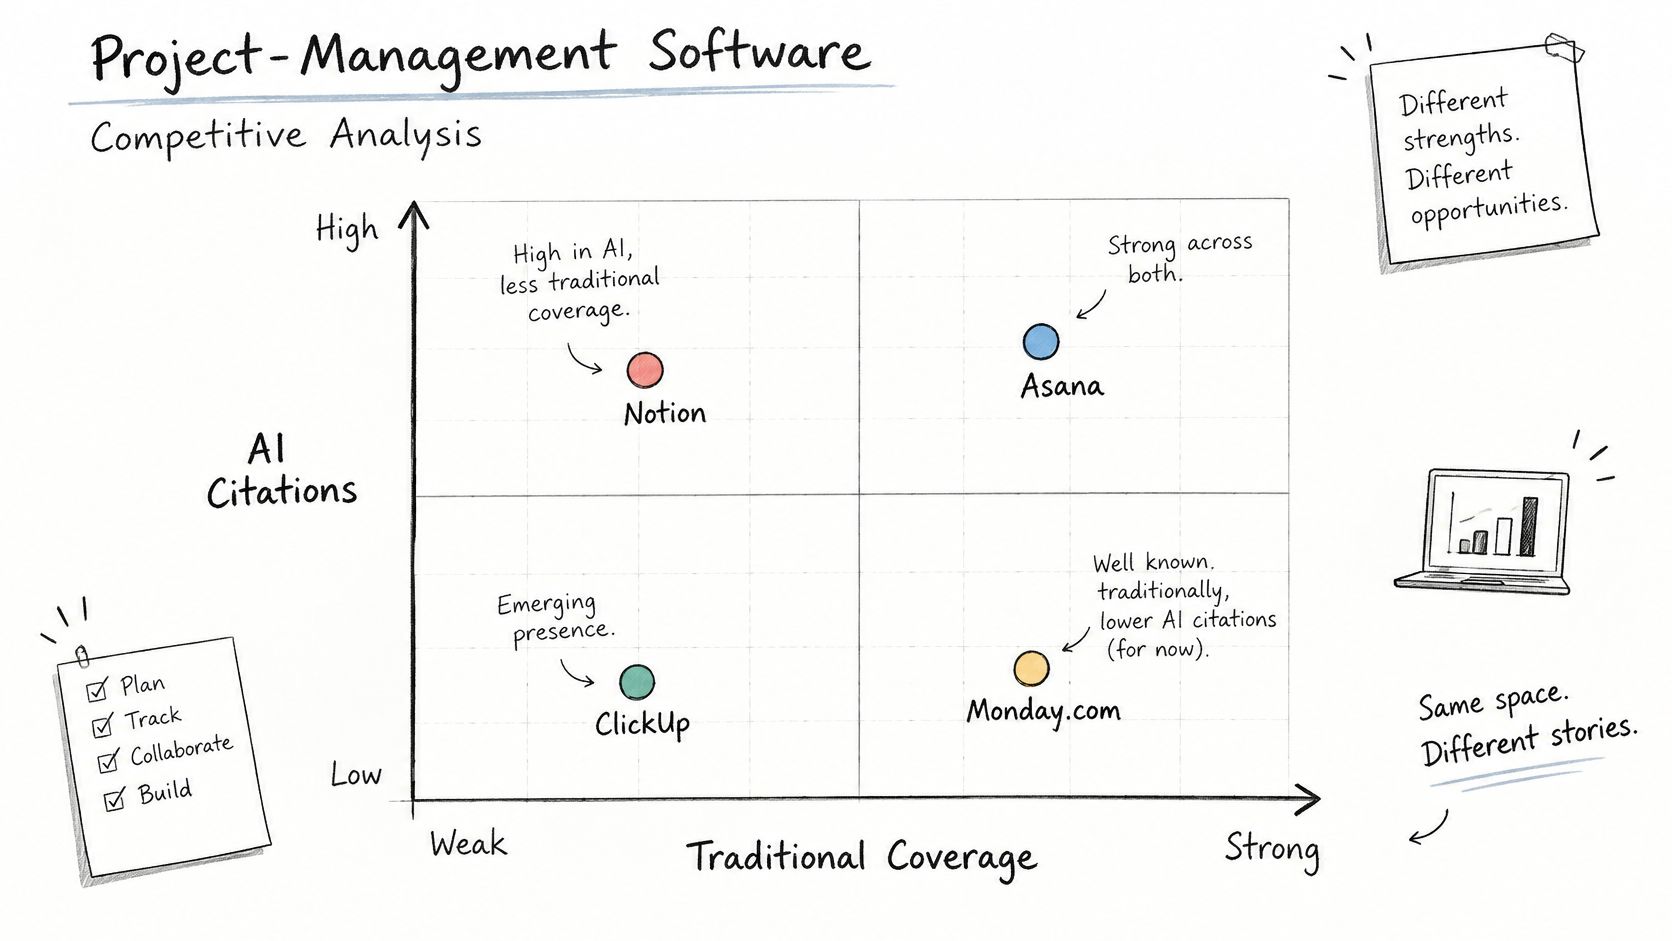
Say you're comparing project-management software. The horizontal axis shows traditional top-10 coverage, and the vertical axis shows AI citation rate for the same buying-question cohort. Read each position as an investigation prompt, not a verdict about product quality.
Quadrant readings for the project-management cohort
| Position | Reading | Action |
|---|---|---|
| Upper left: weak organic coverage, high AI citations | Research target | List the questions where the rival is named |
| Lower right: strong organic coverage, rare citations | Conversational answer content gap | Write answer-style pages rather than pushing rankings |
| Upper right: strong on both measures | Brand to benchmark, not automatically to copy | Study the sources behind its citations |
| Lower left: weak on both measures | Noise until the cohort is large enough | Enlarge the sample before deciding |
Translate the position into a content decision
The upper-left rival deserves a question-level review. List the prompts where it appears, then inspect the cited pages: are they comparisons, implementation guides, integration documentation, or independent reviews? The useful finding is the recurring question-and-source combination, not the rival's logo sitting above yours.
For the lower-right brand, inspect the ranking pages before commissioning more content. A product page may rank for project-management software while leaving questions about migration, permissions, or cross-team reporting unanswered. An answer-style page should address the relevant task directly, with clear constraints and supporting detail, rather than merely rephrasing the keyword as a question.
The upper-right brand is a benchmark, not a template to copy. Its citations may depend on product features, audiences, or external coverage that your team can't reproduce. In the lower-left quadrant, limited observations can make apparent weakness difficult to interpret, so broaden coverage before recommending a withdrawal.
Add an engagement-risk mark
Visibility isn't the same measurement as visits. Pew Research's analysis of Google searches from March 2025, reported by Business Standard, found traditional-result clicks in 8% of searches displaying an AI Overview versus 15% without one, while clicks on links inside summaries occurred in 1% of searches.
For a hypothetical project-management comparison, Brand A might appear in 60% of summaries and Brand B in 20%. That would establish a visibility difference in the example, not a proportional difference in website traffic or demand. Brand A still needs to examine whether its cited pages receive visits and whether those visits contribute to useful actions.
Add a small engagement-risk mark beside each point, with a legend such as referral evidence available, referral evidence limited, or not measured. Don't infer brand-specific click-through rates from category-wide behavior.
A high dot can show strong answer presence without showing that anyone reached the website.
Finish the reading with concrete annotations: who to study, which page type to investigate, and which metric represents visibility rather than demand. Those notes make the graph usable in a content review without inviting claims the axes can't support.
Habits That Keep the Graph Honest
The most useful competitive analysis graph is the one your team can audit after the meeting. Keep the attractive presentation, but preserve the operational record underneath it. The habits below turn a screenshot into a repeatable measurement process.
Protect the comparison
Preserve the prompt library. Store the exact keyword list and generated variations with each chart. If a new analyst adds more comparison questions because they seem commercially valuable, create a separately labeled cohort instead of inserting them into the existing trend.
Keep engine ownership visible. Assign a reviewer to the engine relevant to the buying question. A team prioritizing Perplexity should inspect that series directly rather than relying on an average that also includes ChatGPT results.
These controls protect different things: the prompt library preserves comparability, while engine ownership keeps the analysis tied to a decision. Neither requires a redesigned dashboard. Both require someone to record what changed.
Make source inspection the central habit
- Audit the citation footprint. Pew Research found that 88% of Google AI summaries cited three or more sources, and identified Wikipedia, YouTube, and Reddit as the most frequently cited sources in both AI summaries and standard results in its analysis of Google search behavior. Record both the distinct external domains and their types, rather than stopping at a total citation count.
For the project-management cohort, separate review sites, community discussions, video platforms, and reference pages. A rival supported by several independent source types has a different footprint from a brand appearing only through its own website, even when the mention-rate dots sit nearby.
Turn that inspection into an outreach queue. Record the relevant page, the question it helps answer, whether your product belongs there, and what evidence you could contribute. A community thread calls for a useful, transparent contribution; an inaccurate directory listing calls for a factual correction. Neither calls for a generic request to insert a brand name.
Export an audit package. Save a CSV containing observations, brand mappings, source domains, and calculated values. Keep an accompanying definition sheet so a reviewer can trace a plotted point back to its inputs without access to the original presentation.
Revisit the segment deliberately. When your target buyer changes from small teams to enterprise procurement, reconsider the ideal point and axis definitions. Save the replacement as a new frame rather than stretching the previous chart to describe a different audience.
Audit test: A colleague should be able to explain why a point moved without asking the person who made the slide.
Weekly review works best as a short measurement routine: inspect exceptions, assign source-level work, and record decisions. The result is a history of comparable observations and explicit changes, not a folder of screenshots that nobody can reconcile.
Schedule the Next Competitive Check
Leave the review with one actionable gap, not a plan to redesign every dashboard. Choose the position that changed a decision: a rival cited where you only rank, a mention lead without a corresponding citation lead, or an engine where your brand is absent.
Write a compact experiment record before making the change. Name the target question family, attach the current observations, identify the page or outreach action, and assign an owner. A proposed fix should be specific enough that another person can confirm whether it happened.
Put the hypothesis on the calendar
For a hypothetical schedule, set the recheck two to four weeks after the intervention. Fix the same keywords, country, language, prompt variants, and engine for that comparison. Keep a slice of the cohort untouched as a control, preferably covering similar questions that the edit shouldn't directly affect.
The control won't turn an observational workflow into a perfect experiment. It can still help you notice a broader model or retrieval change that affects treated and untouched questions together. Record other changes, including new external coverage or altered product messaging, rather than attributing every movement to the edited page.
| Experiment field | What to record |
|---|---|
| Before state | Current position and supporting observations |
| Intervention | Named page edit or source-outreach action |
| Control | Unchanged question family |
| Recheck | Calendar date and frozen cohort |
| Decision | Movement required to justify further work |
Keep the causal claim modest
Across 75,000 brands, a study discussed by BrandMentions reported correlations with AI visibility of 0.664 for brand mentions and 0.218 for backlinks, while explicitly cautioning that correlation doesn't establish causation. That distinction matters when a competitor-gap chart suggests acquiring more mentions: the gap is a hypothesis to investigate, not proof of a mechanism.
A competitor analysis dashboard can hold the ongoing record, but the decision log matters as much as the visualization. Keep the proposed cause, observed movement, control behavior, and business outcome in separate fields. If visibility improves without evidence of downstream value, describe the result accurately rather than upgrading it to a demand-generation success.
Book the rebuild before closing the meeting. Attach the saved cohort to the invitation, enter the actual recheck date, and agree which point would have to move before anyone approves more content spending. That commitment gives the next graph a purpose before the answers arrive.
Use LLMrefs to collect conversation-based observations, compare competitor share of voice, inspect citations, and export the evidence behind your competitive analysis graph. Set up your keyword cohort, choose the gap you'll investigate, and schedule the next comparison with the same measurement frame.
Related Posts

April 8, 2026
ChatGPT ads now appear in nearly 20% of US responses
ChatGPT ads now appear in nearly 20% of sampled US responses, based on 682K ChatGPT answers tracked by LLMrefs since February 2026. See who is buying, how fast ads are growing, and how we measure it.

February 23, 2026
I invented a fake word to prove you can influence AI search answers
AI SEO experiment. I made up the word "glimmergraftorium". Days later, ChatGPT confidently cited my definition as fact. Here is how to influence AI answers.

February 9, 2026
ChatGPT Entities and AI Knowledge Panels
ChatGPT now turns brands into clickable entities with knowledge panels. Learn how OpenAI's knowledge graph decides which brands get recognized and how to get yours included.
February 5, 2026
What are zero-click searches? How AI stole your traffic
Over 80% of searches in 2026 end without a click. Users get answers from AI Overviews or skip Google for ChatGPT. Learn what zero-click means and why CTR metrics no longer work.