competitor analysis dashboard, AI search analytics, share of voice, competitor metrics, GEO dashboard
How to Build a Competitor Analysis Dashboard
Written by LLMrefs Team • Last updated October 23, 2026
The dashboard is already open when Monday's competitive review begins. The team has paid for analytics, yet nobody can say which brand gained visibility, where a rival was cited, or whether a particular market has become an opportunity. The charts look complete. The next action isn't.
That's the difference between a collection of metrics and a useful competitor analysis dashboard. A trusted dashboard works as a benchmarking pipeline: it makes comparisons reproducible, shows how much confidence a movement deserves, and gives someone a clear reason to act.
Why Competitor Dashboards Go Unused
In a Monday meeting, an SEO lead asks which competitor gained ground in AI answers. A marketer scrolls through prompt logs, an analyst opens a second report, and an executive asks whether any of it changed customer demand. The dashboard contains data, but answering a basic question takes more effort than the meeting allows.
That pattern isn't unusual. A 2022 survey by BARC and Eckerson Group of 214 data and analytics leaders found that, on average, only about 25% of employees actively used the business-intelligence tools their organizations had purchased. The result had changed very little over the seven years tracked by the research, a reminder that buying a platform doesn't create a usage habit (summary of the BI dashboard survey). Competitive dashboards face the same test: do they help people answer practical questions quickly enough to return to them?
Design around the question, not the data feed
An SEO specialist needs to see changes in share of voice, position, citations, and competitor gaps. An agency team needs to compare client domains without mixing their benchmarks. An executive needs a concise view of what changed and which decision deserves attention. Those users shouldn't have to interpret the same wall of raw prompt logs.
A dashboard earns recurring use when it connects a finding to a plausible next step. A citation gap might prompt a content review; a competitor source that repeatedly appears in relevant answers could become an outreach target; a change in positioning could justify a battlecard update. The metric matters because it helps someone decide, not because it fills a chart.
The design test: If a widget doesn't reduce the effort required to answer a practical question, it probably doesn't belong in the main view.
Calculations should also be explainable. Teams need to understand what counts as a mention, how a position is calculated, and which observations contribute to a share-of-voice comparison. Without those definitions, a change can't be discussed confidently, let alone acted on.
A useful dashboard therefore shows a small set of decision-oriented measures first, with drill-downs for people who need the underlying evidence. Raw observations still matter, but they shouldn't be the only interface. The rest of the work is to define a reliable pipeline, judge uncertainty, connect visibility signals to commercial outcomes, choose a monitoring approach, and establish a review rhythm people will keep.
Build the Benchmarking Pipeline First
Before choosing chart types, define what the dashboard is allowed to compare. A reproducible pipeline starts with three to five genuine competitors, identified using stable details such as domains, product names, and channel handles. Document exclusion rules too, so a similarly named company or unrelated product doesn't enter the comparison unnoticed. A guide to building a repeatable competitive benchmark can help teams turn that decision into a consistent process.
Create a data contract before building charts
Choose 10 to 15 metrics across at least three categories, typically visibility, engagement, and conversion. Write a metric dictionary for each one: definition, source, collection method, time window, denominator, normalization rule, and treatment of missing data. If two competitors have different measurement windows or definitions, their values may look comparable while telling different stories.
| Category | Example metrics | Comparison rule |
|---|---|---|
| Visibility | Share of voice, position, citations | Use the same query set, models, markets, and time window |
| Engagement | Social reach, review activity | Compare like-for-like channels and periods |
| Conversion | Qualified leads, assisted conversions | Use a consistent attribution definition and label estimates |
Keep the raw observations before transforming them. Each record should include a competitor ID, request timestamp, source, and payload. Transform those records into a stable schema for reporting, and maintain a separate error table for authentication failures, empty results, rate limits, and source changes. This helps a reviewer distinguish a genuine fall in visibility from a failed collection run.
A useful dashboard cell shows the current value, prior-period value, direction of change, and a data-quality flag. Start with a baseline snapshot or a 90-day backfill where available. Label estimated values separately from directly observed ones, and let users inspect the rows behind a summary.
Make the reporting calendar consistent
Set a fixed ISO-week calendar and document how often each data source refreshes. Keep the executive view to five to eight top-level metrics, then offer detail on demand. A dashboard with too many headline numbers invites teams to debate what each one means instead of deciding what to do.
The central safeguard is comparability. Mismatched periods, inconsistent definitions, and unnormalized absolute counts can manufacture a competitor story that disappears as soon as someone checks the underlying data. A pipeline makes those assumptions visible before the charts make them persuasive.
Measure Uncertainty Before You Trust Rank
A rank is not automatically news. In AI search, answers can differ by model, location, language, personalization, prompt wording, and changes to retrieval systems. A dashboard that shows a competitor moving up without showing the conditions behind that movement risks turning ordinary variation into a strategy change.
A January 2025 industry survey found no single source of truth for AI-search performance. 55% of respondents were concerned about understanding how AI platforms work, and 49% worried about the pace of innovation (survey context on AI-search measurement). Those concerns make uncertainty a core part of the dashboard, not an optional footnote.
Give rank a confidence check
A useful monitoring view should show the sample size behind a movement, a confidence interval or significance flag, variation by model, and whether a competitor's lead holds across markets. These details answer the operational question: is there enough evidence to change the plan this week, or should the team wait for another cycle?
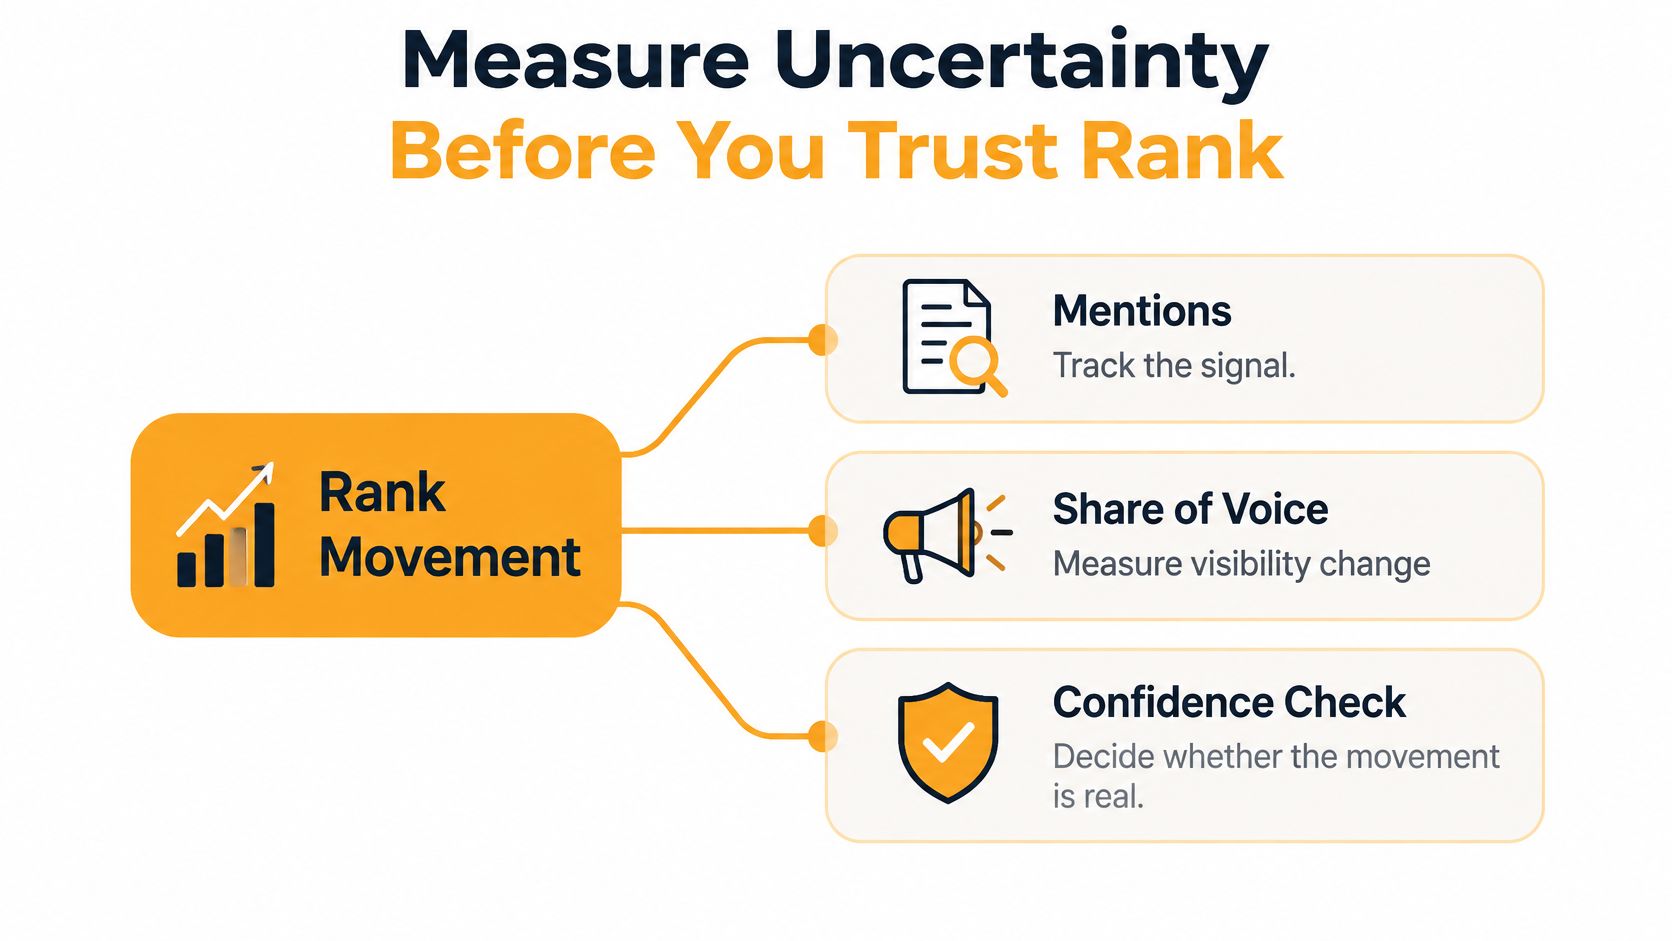
Consider a week-over-week review where one model starts mentioning a rival more often, but the aggregate view across models remains flat after statistical checks. The team can inspect whether the spike is limited to a particular market or prompt pattern instead of rewriting content in response to one unstable result. The rank is worth investigating, but it hasn't yet earned the authority to redirect the content calendar.
An unexplained leaderboard can be worse than no leaderboard. If people treat a short-lived model change as a durable competitive advantage, they may spend time optimizing for a signal that doesn't hold across their audience. The practical decision rule is simple: act when the movement is supported across relevant observations; wait when the apparent lead depends on a narrow slice of the data.
LLMrefs fits this monitoring need by generating conversation-based prompts, repeating observations, checking statistical significance, and separating model and geography effects rather than leaving teams with raw prompt logs alone. Teams assessing visibility measurement can also review how SEO visibility scores can be interpreted. The important result is not a more elaborate ranking. It's knowing when that ranking is reliable enough to change the next action.
Connect Visibility Gaps to Business Outcomes
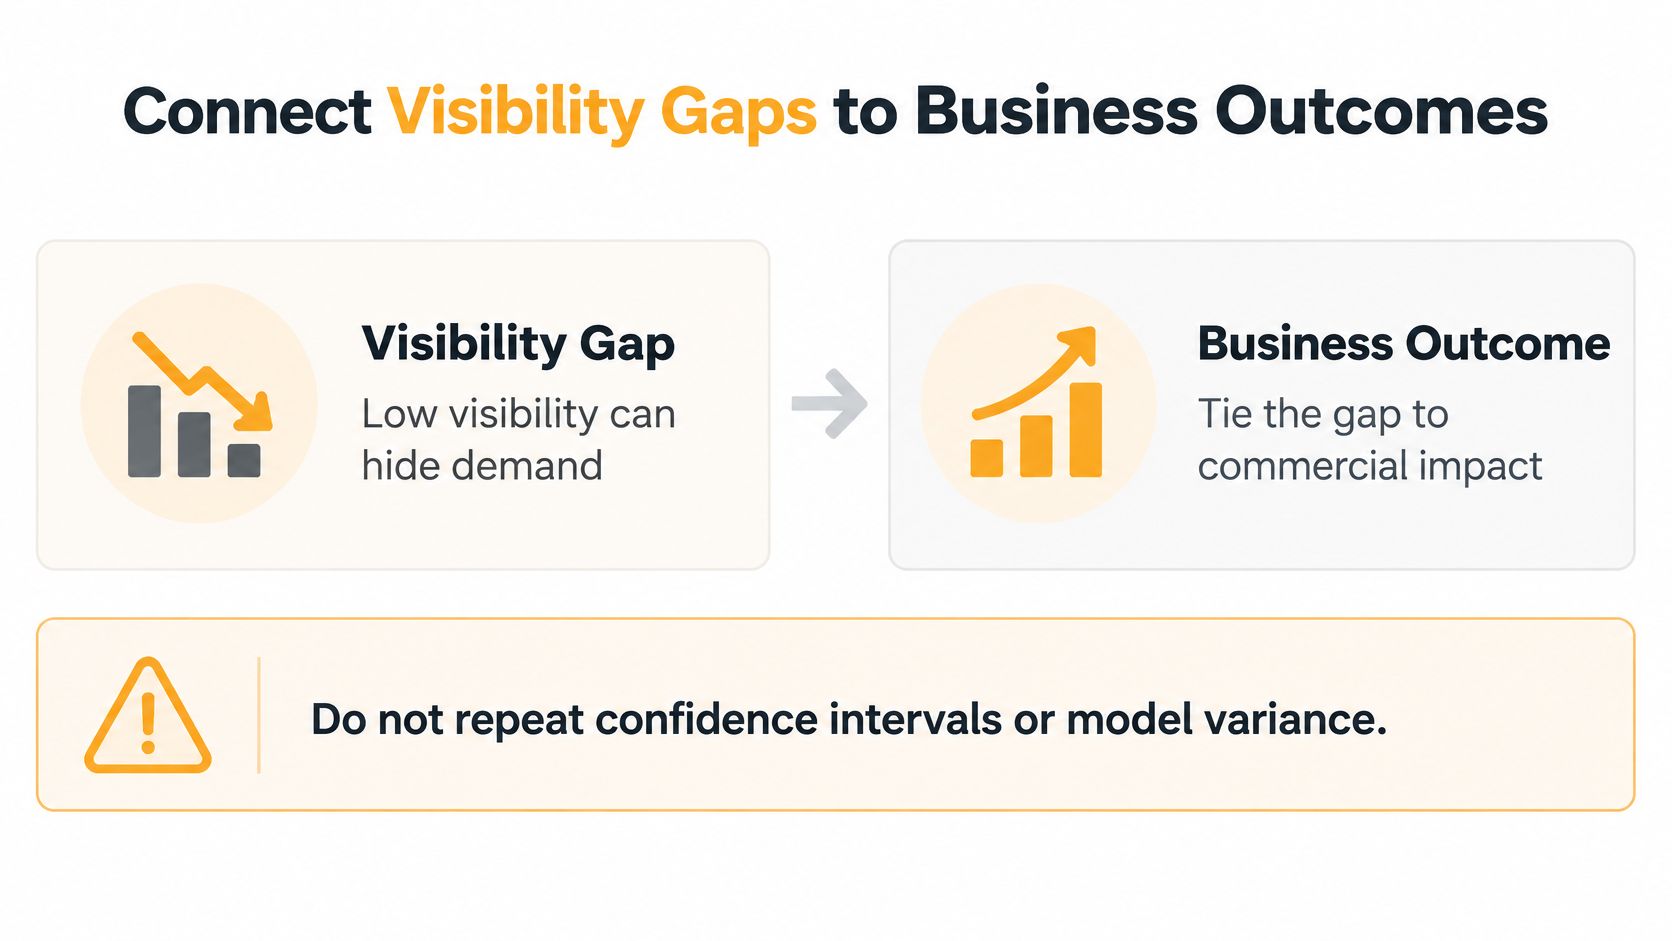
A dashboard can show your brand gaining citations while qualified leads stay flat. That gap matters: visibility is an exposure measure, not a commercial outcome. Connect competitor mentions to downstream evidence, and distinguish a change in attention from a change in demand.
AI referrals illustrate why volume and quality need separate measures. Across 10 major industries, AI platforms generated about 1% of overall web traffic, and ChatGPT supplied 87.4% of AI referral traffic. In a separate analysis of 100 websites and more than 145 million sessions, ChatGPT produced 0.62% as many sessions as Google organic search. Yet, among sites tracking conversions, ChatGPT visitors converted at 13.8% versus 3.02% for Google organic visitors (analysis of AI referral traffic). These figures describe different parts of the funnel. A low visit share can coexist with stronger conversion among the visitors who arrive.
Pair visibility signals with commercial evidence
Place share of voice and citations beside assisted conversions, branded-search movement, qualified leads, and referral quality. Label the relationship correlation unless the team has evidence for a causal conclusion. Attribution has blind spots: someone may encounter a brand in an AI answer, then return later through direct or organic traffic.
For example, your brand might earn more mentions overall while a rival appears less often on high-intent queries and sees stronger commercial follow-through. The larger mention count may reflect low-intent exposure; the rival's narrower visibility may reach buyers closer to a decision. Include query intent and citation context so analysts can tell these patterns apart before recommending a budget change.
In a weekly review, a correlation can justify investigation, not a claim that visibility caused a conversion increase. Check whether the same queries, markets, and period show both the visibility movement and the downstream change. If the evidence is mixed, record the relationship as unconfirmed and monitor it rather than assigning revenue to a citation.
The dashboard should help someone defend a budget decision with specific evidence: which valuable query has a visibility gap, what source or content may explain it, and which commercial signal will be monitored. For a framework for connecting search activity with outcomes, see how to measure SEO performance.
Choose the Right Monitoring Approach
The right monitoring setup depends on what the team needs to compare and how often it needs to act. A spreadsheet, a generic BI dashboard, and a purpose-built AI-search platform can all support competitor work, but they differ in how much manual effort it takes to keep comparisons reliable.
A spreadsheet scoreboard is easy to start and useful for a compact watchlist. But freshness, source tracking, and consistency depend on whoever updates it. It can be difficult to inspect why a rank changed or to compare results across locations, languages, and engines without accumulating manual work.
A generic BI tool can turn exported data into flexible reports. It makes sense when a team already has clean data and analysts who can maintain the data model. It won't, by itself, solve the collection and interpretation questions: what counts as a citation, how prompts are generated, or whether a change is meaningful.
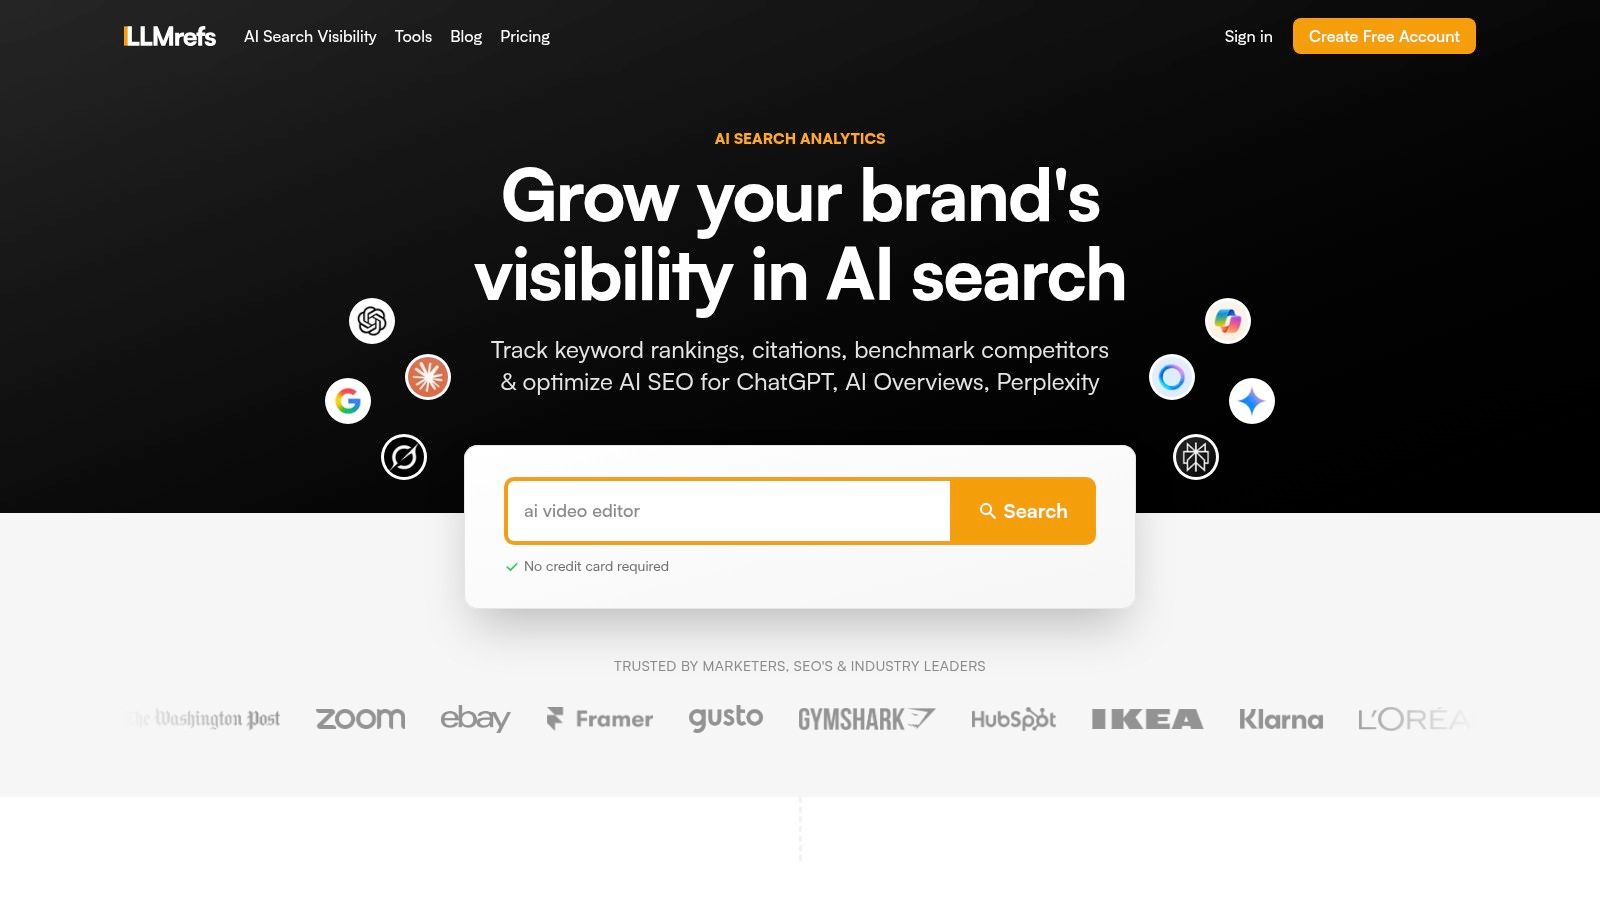
A purpose-built AI-search analytics platform is a better fit when the monitoring job centers on visibility inside answer engines. LLMrefs is a generative AI search analytics and LLM SEO platform. Users set keywords rather than maintaining fragile prompts; the platform generates conversation-based prompts and aggregates responses, citations, and brand mentions into share-of-voice and position metrics across ChatGPT, Google AI Overviews, Perplexity, Gemini, Claude, Grok, and Copilot. It supports geo-targeting across 20+ countries and 10+ languages, weekly updates, statistical-significance checks, cited-source inspection, CSV exports, API access, and unlimited projects and seats for agencies.
Compare the work each option removes
The useful comparison isn't the number of charts. It's whether a team can set up a watchlist, refresh evidence, explain rank, inspect citations, compare locations and languages, and export findings into its workflow. LLMrefs also offers an AI crawlability checker, Reddit threads finder, A/B content tester, and LLMs.txt generator as adjacent utilities for the same AI-discovery work. Teams can start free and upgrade to track 50 keywords for $79 per month.
For organizations evaluating unfamiliar procurement markets, FederalPipeline's resource on qualifying federal pursuits offers a separate perspective on qualifying opportunities. It's a useful reminder that competitor visibility is only valuable when teams can inspect the opportunity behind it.
The following video can help teams see the platform in context.
Choose the option that makes competitor gaps inspectable and repeatable. More charts don't compensate for stale inputs or unexplained comparisons.
Widgets Cadence and Practical Tips
AI-search widgets need to show whether a competitor's visibility change is real, where it appears, and what it may mean for demand. Organize the view around prompts, models, markets, and cited sources. A rank without those conditions is hard to interpret: a shift may reflect one model's response or a changed citation set, not a broad competitor move.
Match the view to the decision
Use a prompt-level trend widget to compare visibility across the same prompts, models, locations, and review periods. Pair it with a citation widget showing which sources appear, disappear, or gain prominence. A movement confined to one model or a small set of prompts calls for investigation; consistent movement across the defined watchlist is stronger evidence for changing a content or positioning priority.
Set cadence by signal speed. Review prompt and citation changes weekly, using the same query set and comparison window so the team can distinguish movement from sampling noise. Review slower commercial indicators on a longer cycle, and keep them beside the visibility trend rather than treating rank as an outcome. Changes to traffic, assisted conversions, or sales can support a business interpretation, but should not be attributed to visibility without checking timing and other plausible causes.
A useful widget makes its limits visible. Label the prompt set, model, market, period, and sample size, and flag incomplete or inconsistent observations. If a competitor gains visibility in a narrow group of prompts, present that as a specific gap, not a market-wide lead. The team can then decide whether to inspect the cited pages, test its own content, or wait for another review before assigning work.
Use the review to assign work: a new citation pattern can prompt source and content review; a repeated visibility gap tied to a relevant commercial measure can justify a focused test.
Keep the dashboard scannable by giving each widget one decision to support. For commerce teams comparing search visibility with operating performance, a profitability-first guide for Amazon brands provides context for looking beyond top-line exposure. Use it to frame the commercial question, while keeping AI-search evidence and its conditions visible in the dashboard.
Put the Dashboard to Work This Week
A workable launch doesn't need a new data team. Start with a short competitor watchlist, define the metrics before charting them, check whether a rank movement deserves trust, and judge visibility against commercial evidence. The dashboard's job is to turn those decisions into a review people can repeat.
Name three to five competitors and lock five to eight executive metrics for the first view. Set a weekly review for fast-moving signals and a monthly review for slower measures. For every widget, write down the action it's allowed to trigger. A citation gap may lead to content review or outreach research; a confirmed shift in positioning may prompt a battlecard update.
Use a consistent meeting checklist
- What changed? Identify the movement and the period being compared.
- Is the change significant? Check the data-quality flag and confidence indicator before treating rank as news.
- What drove it? Name the model, market, or citation context associated with the change.
- What action follows? Assign a content, outreach, or sales enablement task to an owner.
- What outcome will we check later? Choose a downstream measure such as assisted conversions or win rate.
Keep the later check separate from the initial visibility signal. A team shouldn't call a content change successful because mentions rose; it should look for supporting commercial evidence over the review period.
LLMrefs offers a practical starting point for monitoring visibility in AI answer engines. Open a free project, add keywords and competitor domains, and review share-of-voice, position, citation, and gap views during the next weekly cycle. If the watchlist outgrows the free start, the 50-keyword plan costs $79 per month.
The outcome is an operational dashboard people reopen because every number has an owner, a definition, and a next action.
LLMrefs helps teams compare competitor visibility, positions, citations, and gaps across AI answer engines, with repeatable monitoring and source inspection. Start a free project and visit LLMrefs to build a competitor benchmark your team can use in its next review.
Related Posts

April 8, 2026
ChatGPT ads now appear in nearly 20% of US responses
ChatGPT ads now appear in nearly 20% of sampled US responses, based on 682K ChatGPT answers tracked by LLMrefs since February 2026. See who is buying, how fast ads are growing, and how we measure it.

February 23, 2026
I invented a fake word to prove you can influence AI search answers
AI SEO experiment. I made up the word "glimmergraftorium". Days later, ChatGPT confidently cited my definition as fact. Here is how to influence AI answers.

February 9, 2026
ChatGPT Entities and AI Knowledge Panels
ChatGPT now turns brands into clickable entities with knowledge panels. Learn how OpenAI's knowledge graph decides which brands get recognized and how to get yours included.

February 5, 2026
What are zero-click searches? How AI stole your traffic
Over 80% of searches in 2026 end without a click. Users get answers from AI Overviews or skip Google for ChatGPT. Learn what zero-click means and why CTR metrics no longer work.