competitor analysis matrix, competitive intelligence, SEO strategy, AI visibility, marketing templates
Competitor Analysis Matrix: Build, Score, and Use One
Written by LLMrefs Team • Last updated October 15, 2026
Your team spent two days comparing six competitors across a spreadsheet packed with feature checks, pricing notes, and colored cells. The presentation looked polished, but nobody could answer the only question that mattered: what should we do next, and which competitor deserves attention first?
That failure is common because a competitor analysis matrix is often treated as a comparison chart instead of a decision model. A useful matrix connects evidence to a strategic choice, adds an AI-search visibility layer, exposes meaningful gaps, and shows how much confidence the team should place in each conclusion.
Why Most Competitor Analysis Matrices Fail
Most matrices fail before the first score is entered. A content strategist compares product breadth, pricing, support, brand strength, and a long list of features, then sends the spreadsheet to stakeholders. Reviewers argue about individual cells, the rankings change after every meeting, and the file disappears into a shared drive.
The problem isn't a lack of effort. The matrix answered no defined decision.
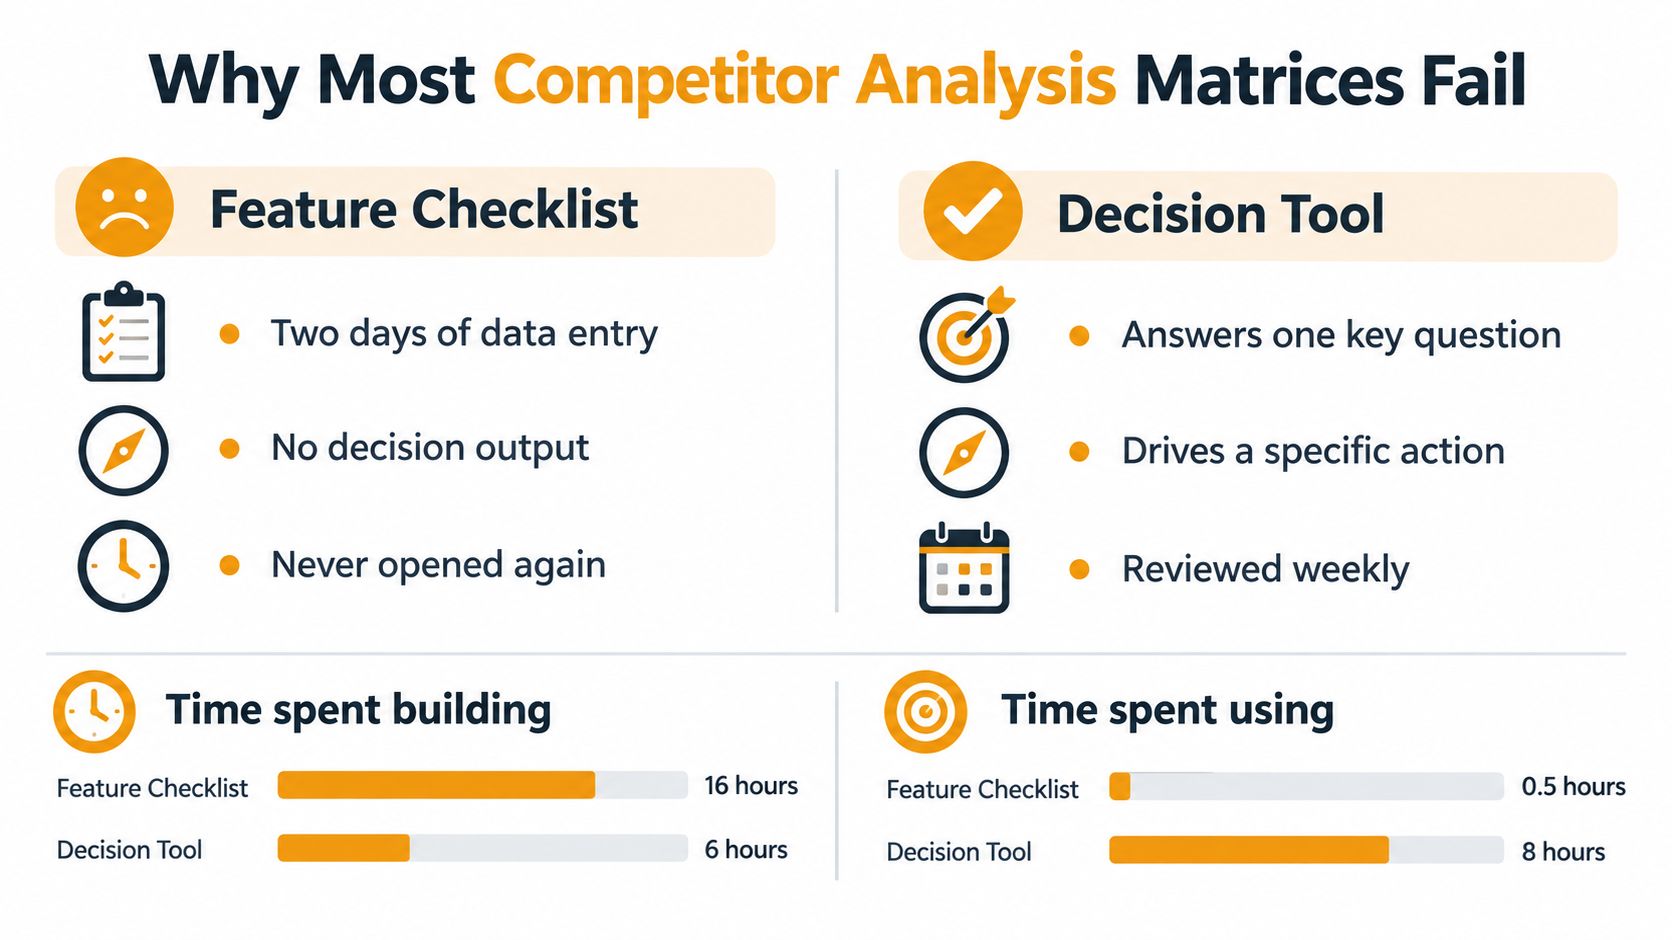
A decision-ready matrix must answer four questions before scoring begins:
- Which decision does it inform? Pricing, product investment, positioning, market entry, or content priorities require different criteria.
- Which competitors matter for that decision? A global category leader may be irrelevant when the choice concerns a narrow segment.
- What evidence supports each cell? A product page, customer review, observed output, interview, or analyst estimate carries a different confidence level.
- What action follows from a gap? If a competitor scores higher, the team needs to know whether to copy, differentiate, investigate, or ignore the gap.
Historical strategy frameworks made matrices durable because they converted qualitative observations into comparable dimensions. SWOT organized information into strengths, weaknesses, opportunities, and threats, with early versions associated with Harvard Business School in the 1950s and Business Policy: Text and Cases, published in 1965. Historical accounts later placed the SWOT acronym in a journal-article title in 1972, while a 2×2 SWOT matrix appeared in an Igor Ansoff article in 1980. The history is useful because it reinforces the point: the matrix is a method for disciplined comparison, not decoration. Historical research on SWOT and matrix development
| Attribute | Comparison Chart | Decision Model |
|---|---|---|
| Purpose | Describe differences | Inform a defined choice |
| Criteria | Long feature list | Decision-relevant measures |
| Evidence | Mixed and often undocumented | Source, date, definition, and confidence per cell |
| Scoring | Subjective totals | Declared scale and weighting logic |
| Output | Ranking or visual summary | Prioritized actions and testable hypotheses |
| Maintenance | Updated when someone remembers | Versioned and reviewed on a set cadence |
Practical rule: If a cell can't change a decision, remove the column.
A strong matrix also survives review cycles. Lock the definitions, preserve raw observations beside normalized scores, record methodology changes, and separate verified measurements from assumptions. Visual polish helps people read the work, but comparability and version control determine whether they trust it.
Locking the Scope and Competitor Set
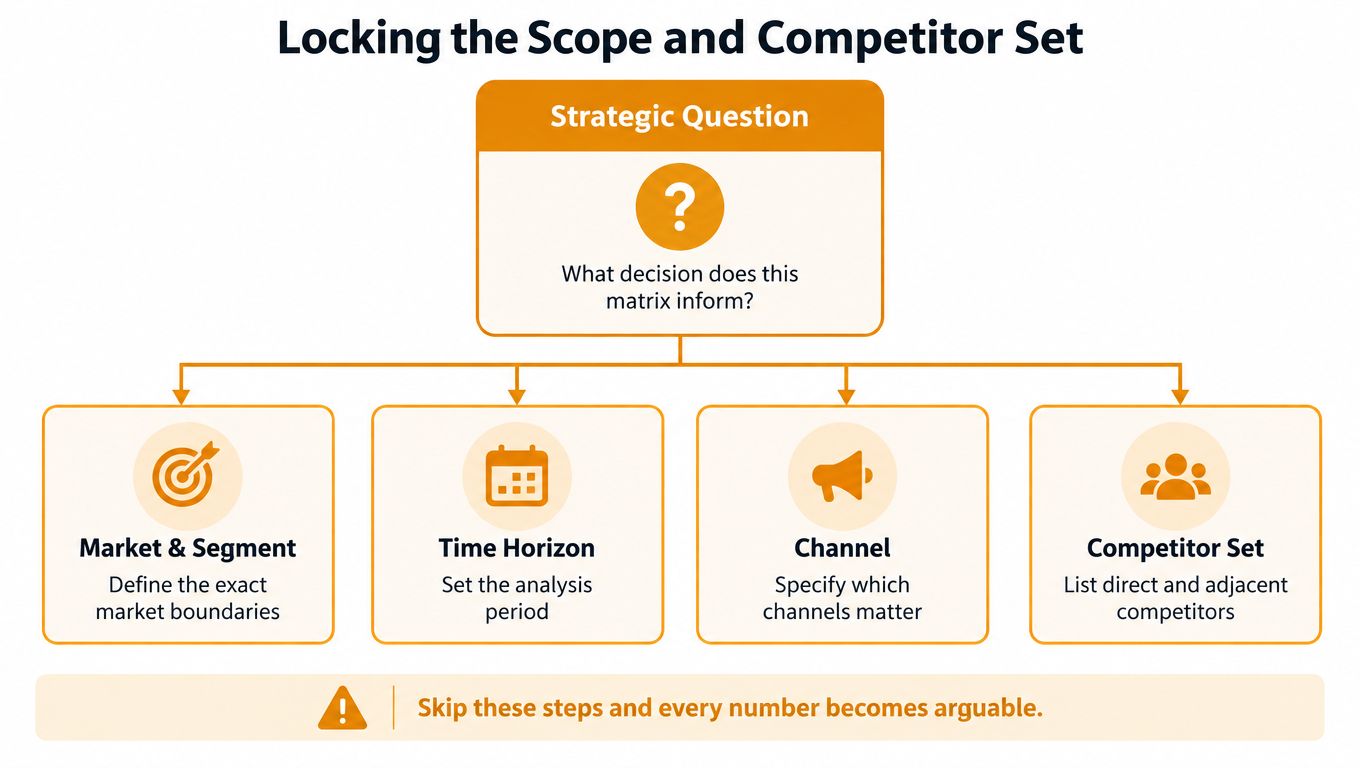
Don't open a spreadsheet until you've frozen the frame. Write down the market, customer segment, time horizon, channel, and strategic questions first. Without that frame, every later score is open to dispute because reviewers are answering different questions.
Start with three to five strategic decisions. Examples include:
- Should the product prioritize enterprise reporting or self-serve adoption?
- Which competitor threatens the highest-value customer segment?
- Where does the brand lack visibility in AI answer engines?
- Which product capability deserves the next investment?
- Which positioning claim can the sales team defend with evidence?
Then define the boundaries. A matrix for European ecommerce SEO shouldn't combine worldwide results, enterprise software buyers, and consumer search behavior. For an AI-search platform, specify the answer engines, countries, languages, keyword classes, response dates, and sampling rules before comparing brands.
Build a competitor set that reflects buyer choice
Use three tiers, and record why each company belongs in the set.
| Tier | Definition | Example Use |
|---|---|---|
| Direct rivals | Sell a similar product to the same buyer | Compare product breadth, pricing, support, and acquisition |
| Adjacent alternatives | Solve the same problem through a different product, method, or business model | Identify substitutes and switching risks |
| Best-in-class analogs | Demonstrate a capability worth studying without competing directly today | Borrow operating or experience standards |
For LLMrefs, this prevents a common analytical mistake: treating every SEO platform as equivalent. Separate tools by use case, such as brand visibility monitoring, citation intelligence, prompt automation, and agency workflow. A citation-monitoring platform and a broad technical SEO suite may both appear in a search result, but buyers don't evaluate them against the same job.
The competitor set should stay stable during a reporting period. If one report includes direct rivals and the next adds a newly discovered substitute, a ranking change may reflect membership changes rather than market movement. Keep an inclusion log with the competitor name, tier, reason for inclusion, excluded alternatives, and date added.
For background on structuring market research before the scoring stage, this market research methods guide via Chicago Brandstarters is a useful supporting resource. For an SEO-specific workflow, see how to do SEO competitor analysis.
Use the video as a discussion prompt, not as a substitute for scope documentation. A team should be able to explain, in one sentence, why every competitor is present and why every major alternative is absent.
Choosing Criteria and a Scoring System That Holds Up
A matrix with twenty criteria usually creates the illusion of rigor. Reviewers can't apply that many definitions consistently, and decision-makers can't see which differences matter. Choose six to ten criteria that map directly to buyer decisions and the strategic questions you wrote down.
Classic criteria may include:
- Price and commercial model, including packaging and contract friction.
- Product breadth, measured through a declared feature taxonomy.
- Distribution reach, such as channels, integrations, or partner access.
- Brand strength, based on a defined evidence set rather than personal familiarity.
- Service model, including onboarding, support, and account coverage.
For AI-search visibility platforms, add criteria such as supported answer engines, citation tracking, reporting depth, geographic coverage, language coverage, API access, and source-gap analysis. LLMrefs can be included as one platform option when the matrix evaluates automated conversation-based prompts, real-time response aggregation, citations, brand mentions, share of voice, position, and competitor benchmarking.
Give every score a definition
A 1–5 scale works only when the points describe observable conditions. For example, a product-breadth score might define 1 as a narrow offering with limited use-case coverage and 5 as broad coverage across the declared use cases. Don't let one reviewer score based on a product page while another scores based on a sales demonstration.
Create a metric dictionary with these fields:
| Field | What to record |
|---|---|
| Definition | What the criterion includes and excludes |
| Unit | Count, ratio, indexed value, or 1–5 score |
| Observation window | The date range or reporting period |
| Evidence source | Documentation, output sample, review, interview, or estimate |
| Normalization rule | How unlike observations become comparable |
| Confidence | Verified, supported, estimated, or unresolved |
Keep raw values beside weighted scores. If a vendor supports several answer engines, preserve the observed engine list rather than storing only a final score. If a competitor appears in AI answers, retain the prompts, response dates, citations, and query categories behind the visibility measure.
Two independent reviewers should be able to work from the same dictionary and reach scores within one point. If they can't, the criterion is still opinion. Fix the definition before debating the ranking.
Weighting, Aggregation, and Sensitivity Analysis
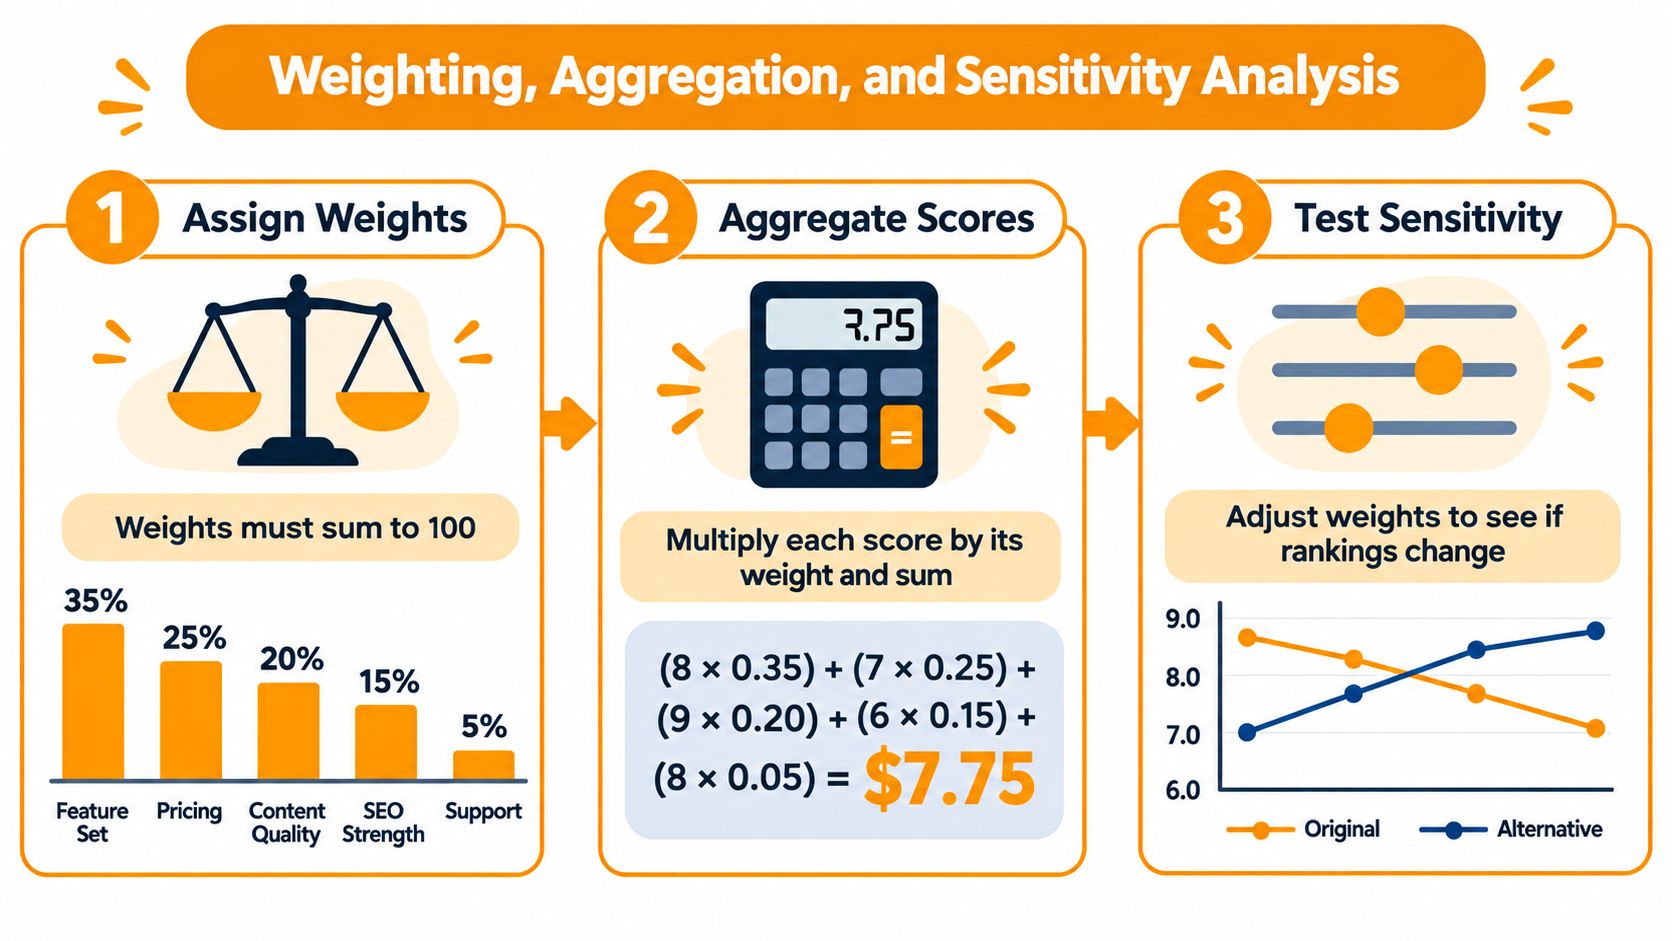
A matrix becomes a decision model when its weights reflect the choice your team must make. Assign weights that sum to 100, then tie each one to the scope statement. For enterprise procurement, support model and API access may carry more weight than feature breadth. For content teams evaluating search visibility, citation tracking and reporting depth should carry more influence.
Use one weight format throughout the workbook:
Total score = Σ criterion score × criterion weight
If a competitor scores 4 on a criterion weighted 0.25, that criterion contributes 1.00 to the total (4 × 0.25 = 1.00). Keep the unweighted score beside the weighted result. This shows whether a competitor leads because of its capability or because the model gives that capability more influence.
Test whether the ranking holds up
Sensitivity analysis reveals rankings that depend on arbitrary assumptions. Copy the weight row, increase one criterion by 10 points, reduce another by the same amount, and recalculate. Repeat this test for each major criterion. Store the original weights in one row, alternative sets below it, and a rank-change column beside the aggregate score.
Read the results in three ways:
- Stable ranking: Reasonable weight changes leave the order unchanged. The recommendation has a clear basis.
- Local movement: One competitor shifts slightly because two offers are close. Report the gap and the quality of the supporting evidence.
- Wild movement: Several competitors change position after minor adjustments. Your criteria may overlap, the evidence may be thin, or the decision question may lack precision.
Do not force a single composite score when it creates false precision. Use quartiles, relative gaps, or separate dimension scores when they show uncertainty more clearly. A competitor can lead on product capability while trailing on commercial fit. One total can hide the trade-off leadership needs to discuss.
A ranking is useful only when reasonable disagreement about the weights does not overturn the decision.
Sensitivity analysis improves the discussion. Stakeholders can ask which assumptions drive the outcome and which evidence would reduce uncertainty, rather than arguing whether one score is right.
Adding the AI Search Visibility Layer
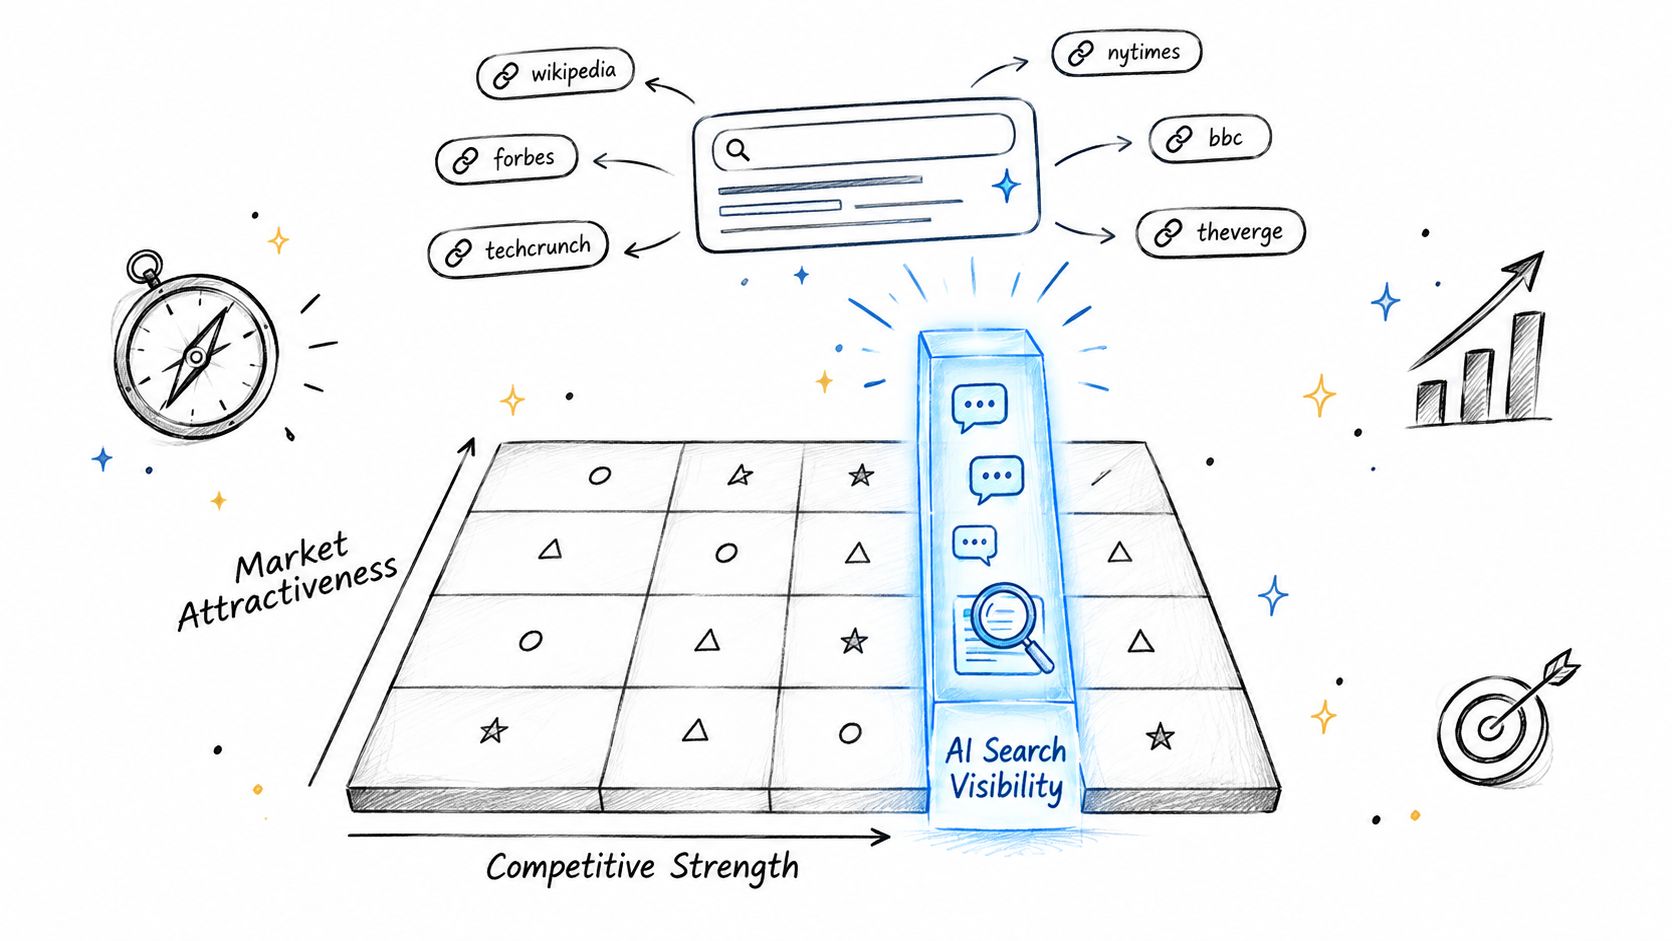
A brand can win on price, product breadth, and support yet remain absent from the answers buyers now read before visiting a search result. Treat AI search visibility as a separate decision layer, not a decorative column added after the matrix is complete. It shows where competitors are being introduced, cited, and recommended during consideration.
Track mention frequency, citation ownership, query intent, geographic coverage, language coverage, referral volume, and conversion quality as separate dimensions. Record confidence beside each cell. A directly observed answer, an analytics referral, and an inferred influence signal do not carry the same evidential weight.
Normalize exposure before comparing brands
A higher mention count means little if one brand was tested against more favorable queries. Use the same keyword classes, countries, languages, model families, response dates, and sampling quotas for every competitor. Split branded queries from non-branded discovery queries, then classify informational, comparison, and transactional intent.
Build the AI layer with separate fields for:
| Dimension | What it reveals |
|---|---|
| Mention frequency | How often the brand appears in eligible answers |
| Citation ownership | Whether its site or content earns source attribution |
| Share of voice | Its relative presence across the defined competitor set |
| Position | Where it appears in an answer or recommendation |
| Query intent | Whether visibility supports discovery, evaluation, or action |
| Geo and language coverage | Whether visibility reaches target markets |
| Referral volume | Whether answer-engine exposure sends measurable visits |
| Conversion quality | Whether those visits support commercial outcomes |
Referral growth provides context, not a reason to inflate the score. Generative-AI referrals rose from about 60 million monthly referrals in October 2024 to roughly 240 million by September 2025, according to Similarweb's AI search trends analysis. AI-driven visits still represented a small share of overall referral traffic in other large-scale analyses, and standard analytics may not connect a visit to the originating AI conversation.
A 2025 GA4 study of 94 ecommerce brands recorded 135,000 ChatGPT sessions versus 9.46 million non-branded organic sessions. It found ChatGPT referral sessions converted 31% higher than non-branded organic-search sessions. Keep those figures in separate columns. The study's scale and conversion result answer different questions, so neither supports a single “AI is valuable” score.
A small number of high-intent citations can outweigh many vague mentions. Score visibility separately from commercial importance, then test how changing their weights alters the ranking. For the operating method, use AI search visibility tracking.
Interpreting Gaps Without Misreading Them
A gap isn't automatically an opportunity. It may reflect a different target buyer, weak evidence, or a capability that customers don't value. The matrix becomes useful when it classifies the gap before recommending an action.
Four gap types require four responses
Capability gap: A competitor has a material capability your product lacks. If enterprise buyers repeatedly require API access and your offer doesn't provide it, investigate the commercial value before adding it. The right action may be product investment, a partnership, or a decision to target a different segment.
Positioning gap: Both companies may offer similar capabilities, but they frame them for different buyers. A competitor emphasizing agency workflow isn't necessarily beating a platform positioned for in-house SEO teams. Repositioning may create more value than feature parity.
Intensity gap: You and a rival both track citations, but the rival covers more relevant answer engines, markets, or query classes. This calls for deeper execution, not a new category.
Confidence gap: Your evidence suggests a weakness, but the observation is sparse or indirect. Mark it unresolved, then run an interview, output sample, or documentation check before funding a response.
The composite score creates another trap. The highest-scoring competitor isn't always the greatest threat. A large rival may rank strongly overall but have little presence in a segment you serve. A smaller competitor can deserve priority when it has strong capability in a high-value segment and a high likelihood of responding to your move.
Use second-order factors such as segment value, competitor capability, likelihood of response, switching cost, strategic fit, and evidence confidence. The formal competitive-intelligence tradition supports looking beyond current features toward future goals, current strategy, assumptions, and capabilities. Porter's Competitive Strategy provides the foundation for that forward-looking analysis
| Observed pattern | Better question | Likely action |
|---|---|---|
| Competitor leads | Does the capability matter to our target segment? | Copy, partner, or deliberately ignore |
| We lead | Is the advantage visible and defensible? | Strengthen proof and distribution |
| Scores are close | Does the evidence support a meaningful difference? | Investigate before prioritizing |
| Ranking changes by segment | Which segment creates more strategic value? | Build segment-specific plans |
Treat the output as a hypothesis set, not a verdict. A practical competitive benchmarking workflow helps teams compare relative performance without mistaking a leaderboard for strategy.
From Matrix Output to Action Register and Cadence
A matrix earns its keep when every material gap becomes an owned action. Don't append a vague “recommendations” slide. Create an action register with enough detail for a team to run the work without reopening the entire analysis.
| Field | Example |
|---|---|
| Gap | Weak citation ownership for high-intent comparison queries |
| Evidence | Prompt samples, cited URLs, response dates, and confidence label |
| Expected impact | Improve source coverage in the selected query class |
| Owner | Content lead, SEO lead, product marketer, or analyst |
| Test design | Publish or update a defined content cluster, then resample identical cells |
| Reassessment date | The next frozen reporting period |
The evidence field should point back to raw observations, not only the final score. If a team decides to improve source coverage, it should know which pages competitors earned citations from, which topics remain uncovered, and whether the gap appeared across models or only in one environment.
Keep the matrix alive without corrupting history
Freeze competitor membership for each reporting period. Log changes to definitions, answer engines, markets, prompt mixes, scoring rules, and data sources. If a definition changes, recalculate historical scores where possible, then mark the break clearly instead of presenting the new series as uninterrupted improvement.
Review the matrix when:
- A new model or answer engine enters the measurement set.
- A new country, language, or customer segment becomes strategically relevant.
- The prompt mix changes enough to alter exposure.
- A competitor launches a material product, pricing, or distribution move.
- A business decision requires a different weighting model.
Benchmarking works as a continuous, systematic, iterative cycle. The historical competitive-intelligence tradition moved from structured industry analysis toward formal organizational processes, including Michael Porter's 1980 Competitive Strategy, Leonard Fuld's dedicated competitor-intelligence book in 1985, and Ben and Tamar Gilad's organizational model in 1988. A history of competitive intelligence and these milestones
Definition of done
Before presenting the matrix, check that it has:
- A frozen scope: Market, segment, time horizon, channel, and strategic questions are explicit.
- A stable competitor set: Direct, adjacent, and best-in-class tiers have inclusion rationales.
- Evidence per cell: Sources, dates, raw values, and confidence labels are retained.
- Comparable metrics: Exposure, query intent, markets, languages, and models are normalized.
- Declared weights: The weighting model connects to the decision being made.
- Sensitivity analysis: Alternative weights show whether the ranking is resilient.
- An action register: Every priority gap has evidence, an owner, a test design, and a reassessment date.
- A scheduled review: Someone owns the next update, and methodology changes are logged.
The file should be easy to reopen because it answers a current decision, not because it contains every fact about every competitor. Keep the chart concise, keep the evidence behind it, and make the action register the part leadership sees first.
Build your next competitor analysis matrix in LLMrefs with comparable AI-search visibility, citations, mentions, share-of-voice, and position data across competitors, answer engines, topics, and countries. Use the findings to identify source gaps and assign evidence-backed actions, then visit LLMrefs to start benchmarking.
Related Posts

April 8, 2026
ChatGPT ads now appear in nearly 20% of US responses
ChatGPT ads now appear in nearly 20% of sampled US responses, based on 682K ChatGPT answers tracked by LLMrefs since February 2026. See who is buying, how fast ads are growing, and how we measure it.

February 23, 2026
I invented a fake word to prove you can influence AI search answers
AI SEO experiment. I made up the word "glimmergraftorium". Days later, ChatGPT confidently cited my definition as fact. Here is how to influence AI answers.

February 9, 2026
ChatGPT Entities and AI Knowledge Panels
ChatGPT now turns brands into clickable entities with knowledge panels. Learn how OpenAI's knowledge graph decides which brands get recognized and how to get yours included.

February 5, 2026
What are zero-click searches? How AI stole your traffic
Over 80% of searches in 2026 end without a click. Users get answers from AI Overviews or skip Google for ChatGPT. Learn what zero-click means and why CTR metrics no longer work.