share of voice, SOV formula, AI share of voice, SOV benchmarking, brand visibility
SOV Share of Voice: Formula, Benchmarks and AI Visibility
Written by LLMrefs Team • Last updated November 6, 2026
You're preparing a quarterly review and someone asks a simple question: are we more visible than our competitors, or less? Your traffic is up, a campaign performed well, and a few AI answers mention you. None of that answers the question, because visibility only means something next to everyone else competing for the same buyer.
That's what SOV share of voice measures. It's not how loud you are on your own. It's your share of all the noise in a defined market, channel, and period. Get the denominator right and the number becomes useful. Get it wrong and you'll chase movements that are really just changes in what you counted.
What Share of Voice Measures and Why It Matters
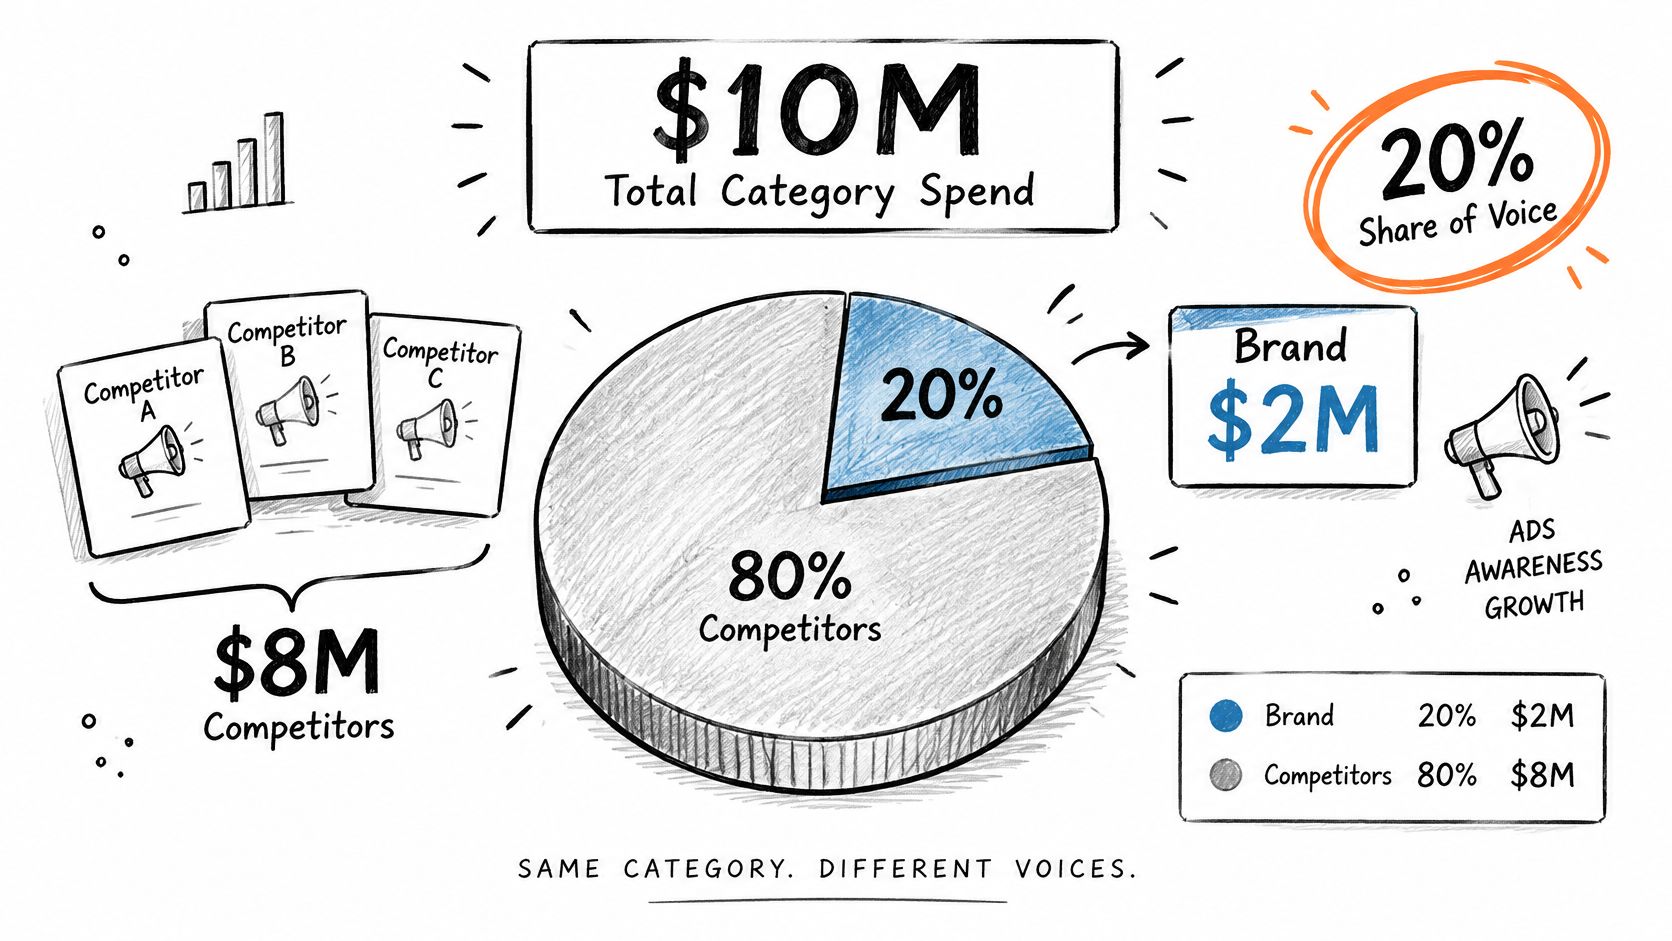
Say your brand spends $2 million on advertising in a quarter. Your competitors collectively spend $8 million. Is $2 million a lot? On its own, you can't tell. Together, category spend is $10 million, so you hold 20% of the voice. That worked example comes from Nielsen's explanation of share of voice, which defines SOV as a brand's proportion of category advertising expenditure.
Share of Voice = brand media spend ÷ total category media spend × 100, for a defined category, market, channel, and time period.
Why the Ratio Matters More Than the Budget
Think of a crowded room. You don't measure your volume against silence. You measure it against everyone else speaking at the same time. The same $2 million can dominate a quiet niche where rivals barely advertise, or disappear in a crowded category where several brands outspend you. SOV captures that difference because it's relative by design.
SOV began with advertising spend, then widened as buyers moved. Today teams apply the same logic to search results, social mentions, media coverage, and AI answers. The unit changes. The question doesn't. You're still asking what proportion of qualifying visibility belongs to you.
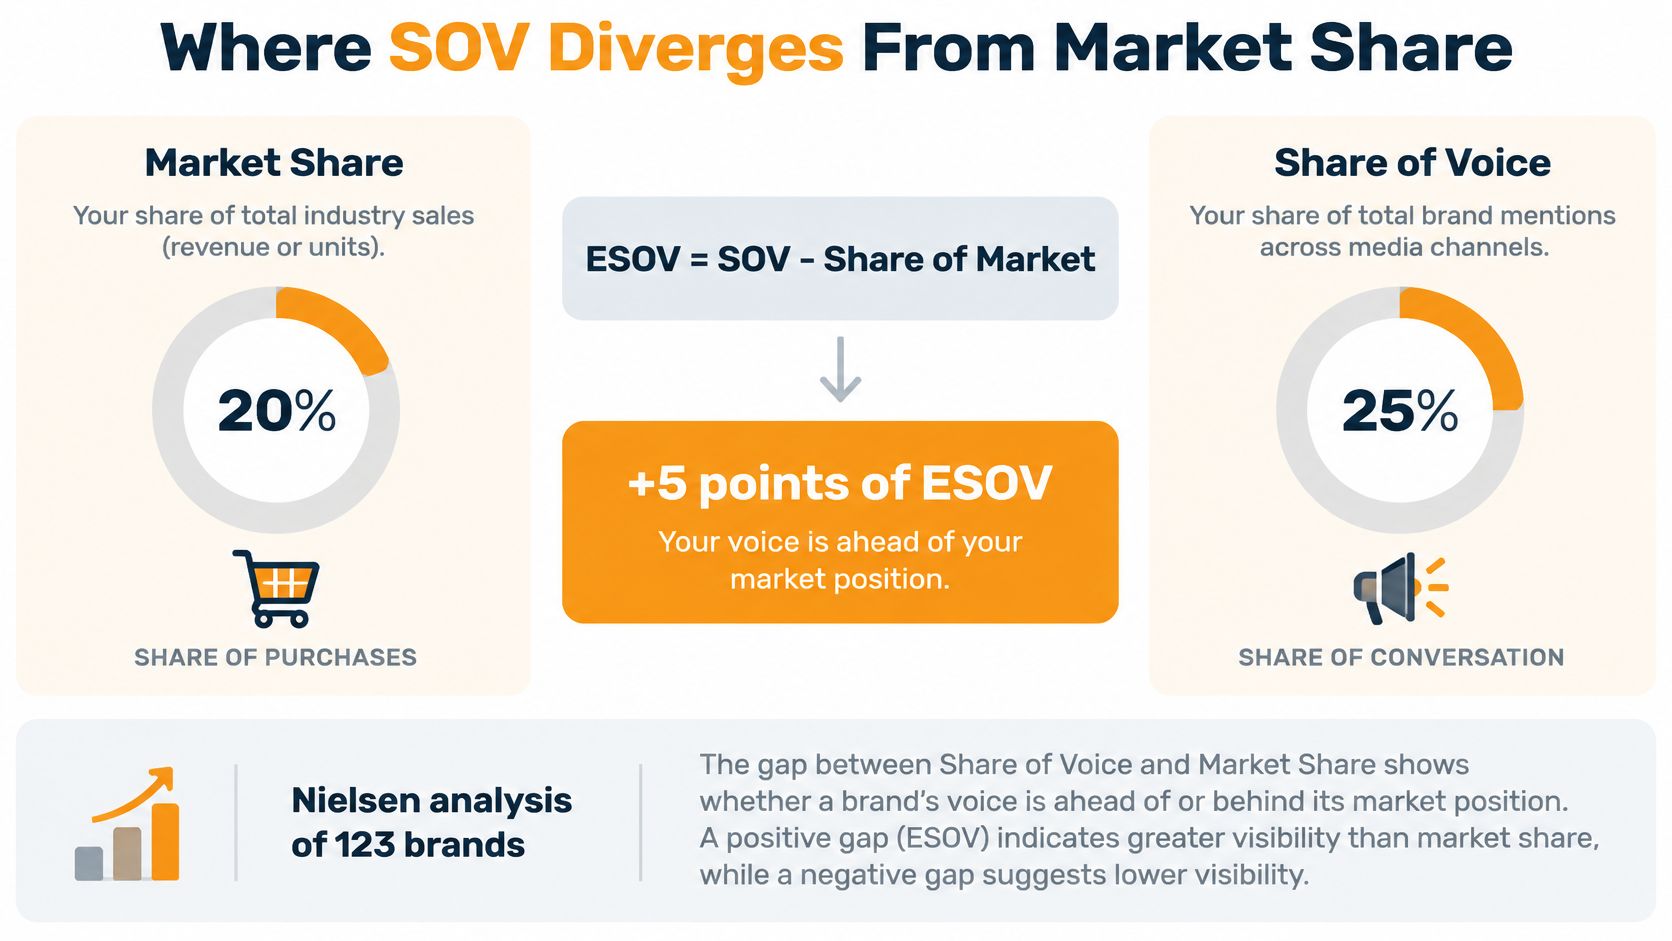
Don't confuse that with share of market (SOM), which is your percentage of category sales. SOV tracks presence. SOM tracks revenue already won. The gap between them is excess share of voice (ESOV), calculated as SOV minus SOM, and it's where the planning value sits.
What to Write Down Before You Calculate
A number without boundaries invites arguments. Before you calculate anything, record three things in your tracker:
- Category and channel: Which market and which kind of visibility are you counting?
- Time window: Which weeks or months does this cover, exactly?
- Competitor set: Which named brands make up the rest of the denominator?
That discipline carries into adjacent reporting too. If you're building templates for clients in other verticals, it helps to see how practitioners track golf membership marketing ROI with fixed definitions before they judge results. For search specifically, our guide to understanding your SEO visibility score shows how a visibility number stays comparable when the underlying set doesn't shift under you.
Do that setup first. Then 20% means something your whole team can defend.
How to Calculate SOV for Each Channel
Every channel uses the same logic with a different unit. Spend in one place, impressions in another, mentions in a third. If you keep the unit consistent inside a channel, the percentages become comparable across brands and periods.
| Channel | Numerator | Denominator | Worked Example |
|---|---|---|---|
| Paid search | Your ad impressions | Total eligible category impressions | 150,000 of 750,000 = 20% |
| Paid media (TV, display, print) | Your media spend | Total category media spend | $2M of $10M = 20% |
| Organic social | Your brand mentions | Total qualifying brand mentions in the category | 500 of 2,000 = 25% |
| Organic search | Top-10 result slots held by your domain | Total top-10 slots across tracked keywords | 30 of 200 = 15% |
| AI answer engines | Brand mentions in generated answers | Total qualifying brand mentions across the same prompt set | 60 of 300 = 20% |
The Five Calculation Steps
- Define the category, market, and period. Pick the country, language, channel, and dates first. Everything else depends on these choices.
- Count your qualifying units. Count only what meets your rules. If a mention is off topic or from the wrong market, it doesn't belong in the numerator.
- Count units for every brand in the set. Apply identical rules to competitors. A generous rule for you and a strict rule for them manufactures a lead.
- Divide and multiply by 100. Your count divided by the total gives your share. Repeat the same division for each competitor so the shares add up.
- Repeat per channel and per period. Don't blend channels into one score yet. A brand can lead on social and trail badly in AI answers.
Take the AI row. Say a fixed prompt set produces 300 qualifying brand mentions across all tracked brands, and 60 name you. That's 20% SOV. Notice what this isn't. It isn't the percentage of answers containing your name. Your mention rate could rise while your share falls, if competitors get mentioned even more often in the same answers.
Report mention rate and relative SOV side by side. One shows raw presence, the other shows competitive position, and they can move in opposite directions.
The Denominator Mistake to Avoid
The most common error is mixing denominators, such as dividing social mentions by search impressions. The units must match. Google's impression share methodology offers a useful model here, because impression share divides received impressions by estimated eligible impressions, with eligibility shaped by targeting, approval, quality, and auction conditions.
Copy that discipline. Freeze your eligibility rules, including keyword intent, country, language, model, and sampling, before you compare periods. Then segment by engine and market, since an aggregate can hide a lead in one engine and a loss everywhere else. Alongside SOV, record absolute mentions, citation frequency, and average mention position, so you can tell whether a shift came from prompt coverage, a new competitor, or a change in model mix.
Your checkpoint is simple. Pick one channel this week, calculate SOV, and write the denominator in one sentence. If you can't state it plainly, the number isn't ready for a report.
Where SOV Diverges From Market Share
A brand holds 20% market share and runs at 25% SOV. Subtract one from the other and you get +5 percentage points of ESOV. That gap tells you whether your voice is ahead of your current commercial position or behind it.
What the Best Known Evidence Shows
The most cited numbers come from Nielsen's analysis of 123 brands across 30 categories, which used typical campaigns rather than exceptional award winning work. On average, a 10-percentage-point ESOV advantage was associated with approximately 0.5 percentage points of additional market share growth over one year. In Nielsen's worked example, a brand at 20.5% market share with SOV 10 points above its SOM would be expected to reach about 21.0% after a year.
Read those figures carefully. They're an average relationship across categories, not a promise for your brand. Pricing, distribution, product quality, competition, creative effectiveness, and economic conditions also move market share. A weak product with heavy advertising doesn't grow just because it's loud.
Think of a loudspeaker in a crowd. Speaking louder than your share of the room helps only if the people listening are also in a position to buy, and like what they hear.
How to Use ESOV Without Overclaiming
- Positive ESOV: You're investing above your current position. Growth becomes more likely, not certain.
- Negative ESOV: Your voice trails your sales share. You're relying on past strength and may lose ground.
- Roughly balanced: Voice and sales match. Expect stability unless something else changes.
Calculate ESOV each quarter and track its direction alongside actual market share. Treat it as an early signal that prompts questions, never as a standalone forecast. That separation, between what the data shows on average and what it guarantees for you, keeps the metric honest.
Measuring SOV Inside AI Answer Engines
The trap in AI measurement is counting every citation as a win. A 2026 analysis reported that 61.7% of AI search appearances were "ghost citations," where a brand's site was cited without the brand being named in the answer, according to iPullRank's AI search statistics compilation. Your page helped build the answer. The reader never learned your name.
The visual below illustrates how a cited source can stay invisible to the person reading the answer.
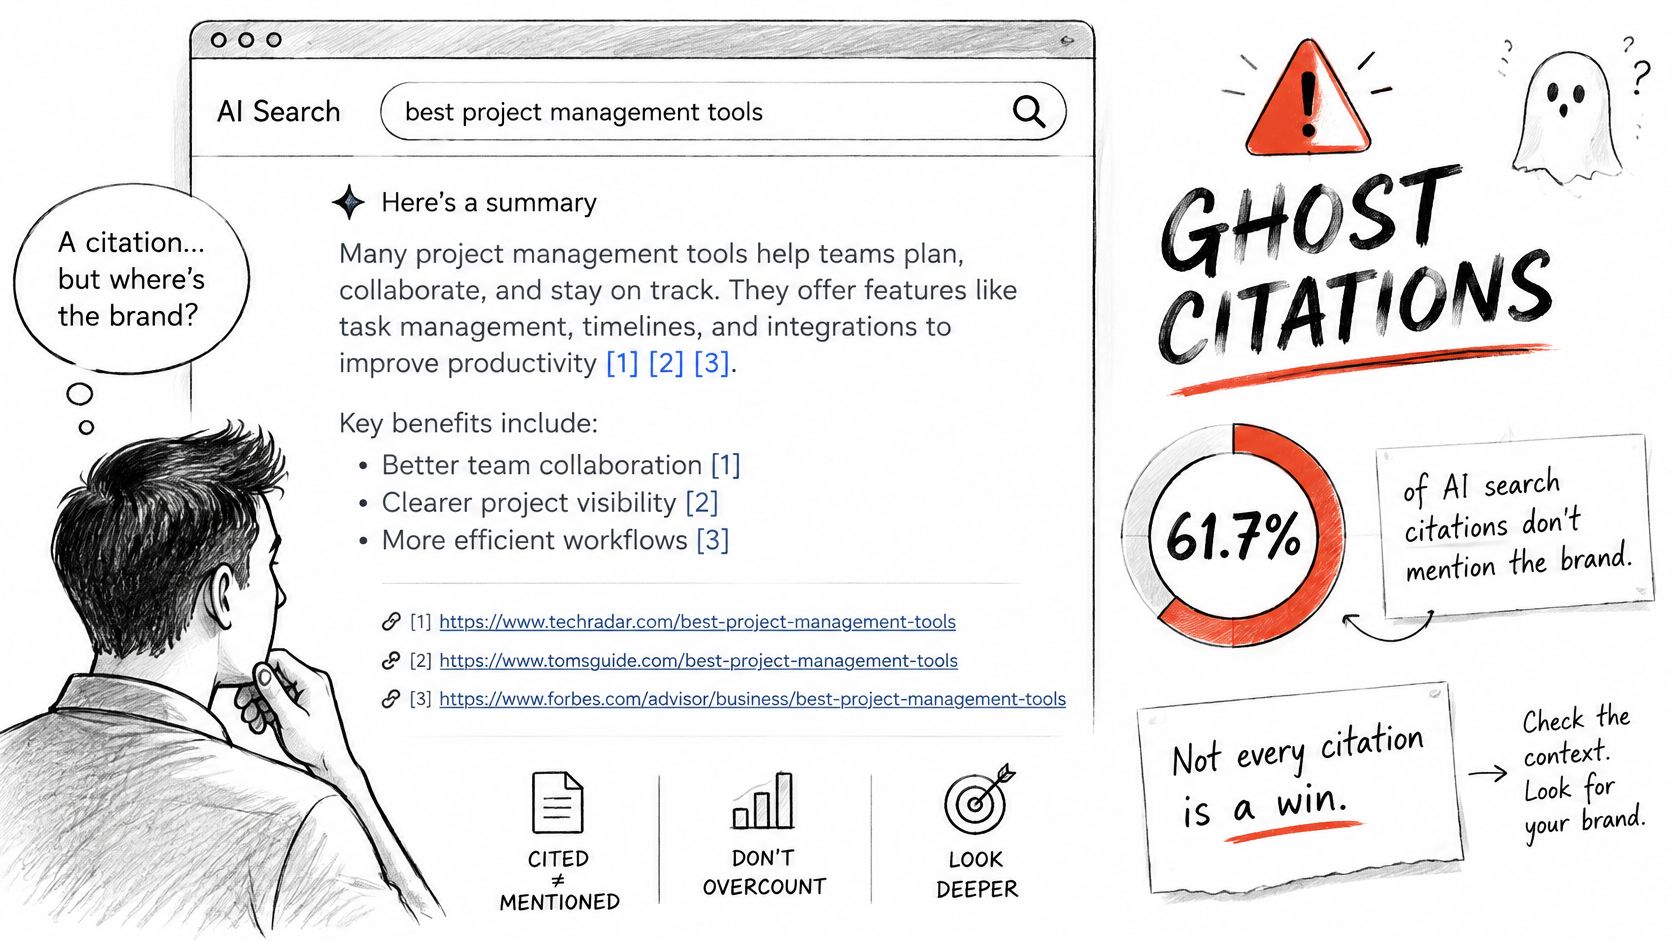
Rankings don't rescue you here either. Pew Research's analysis of March 2025 browsing behavior found users clicked a traditional search result link in only 8% of visits with an AI summary, compared with 15% without one, and clicks on links inside the summary occurred in just 1% of visits. Say someone asks for the best project management software. The generated answer names three tools and links five sources. If you're a source but not a named tool, standard rank tracking calls that visibility. The buyer never considered you.
In a low click environment, being named and recommended can matter more than being cited in small print.
Four Metrics to Report Together
| Metric | What It Measures | How to Count It | Why It Matters |
|---|---|---|---|
| Explicit mention share | Brand named in the answer | Named mentions divided by all qualifying brand mentions | Shows direct recognition |
| Cited-source presence | Your domain appears in cited sources | Citations of your domain divided by all cited sources | Shows evidence use, not recognition |
| Mention position | Where your brand appears in the answer | Average position across answers in the set | Shows prominence |
| Recommendation share | Brand recommended as a top choice | Recommendations divided by all recommendations | Shows consideration |
| Sentiment mix | Positive, neutral or negative mentions | Share of mentions by tone | Shows whether mentions help or hurt |
Add sentiment because tone changes the meaning of a mention. You can gain mention share while losing consideration if answers name you for outdated pricing or poor support. Named, early, recommended, and positive is the combination worth chasing.
The short video below walks through how answer level visibility differs from citation counting in practice.
Freeze your eligibility rules before you start: keyword intent, country, language, and model. Segment by engine, because leading in one model while trailing in others produces a blended number that misleads everyone. LLMrefs supports this reporting habit by showing mentions, citations, and positions across engines, and it gives customers stable, comparable visibility metrics instead of one-off screenshots.
Publish mention share, citation share, and recommendation share together, with the prompt set and sample size attached. Anyone reading the report should be able to check what each number counts.
Keeping SOV Numbers Reliable Over Time
Ask an AI engine the same question twice and you may get two different answers. Generated responses vary across runs, models, and prompt wording. A single screenshot therefore proves almost nothing, however good it looks in a slide deck.
How Many Observations Do You Need
A published multi-model design in Radyant's persona effect study used approximately 432 observations per individual model, from 54 days multiplied by 8 prompts, and approximately 2,160 observations for its all-model aggregate. It tested brand mention rates with two-proportion z-tests and controlled multiple comparisons using the Benjamini-Hochberg false-discovery-rate procedure.
You don't need to replicate that exact design. You do need a comparable order of magnitude before you treat a gap between brands as real. Set the sample rule before benchmarking, not after you see results you like.
Aggregate repeated runs over a defined window, keep prompt groups constant, and call a change significant only when a preselected test or confidence interval supports it.
Prompt Wording Is a Cause, Not a Detail
The same study reported share of voice changes as large as 9 percentage points after adding persona context. Role, problem framing, and buyer intent changed which brands models recommended. Say you add "for a 50 person agency" to a prompt set mid quarter. Your SOV jumps. That jump tells you about the new prompts, not about improved authority.
Separate your prompt groups accordingly:
- Generic informational prompts: Definitions and how things work, with no buyer context.
- Persona prompts: A named role, team size, or use case is built into the question.
- Commercial prompts: Comparisons, alternatives, and best tool questions tied to a purchase.
Never mix a prompt template revision into a performance trend. Version your templates, note the change date, and restart the comparison from there. Publish sample sizes next to every percentage so readers can judge the weight behind it. Our guide to brand monitoring for AI results covers how to structure that ongoing tracking without chasing noise.
Act on a deficit only where it's statistically supported and lines up with weak citations or low mention position. That combination points to a real gap. A two point wobble on a handful of runs points to nothing.
How to Benchmark Your SOV Against Competitors
A benchmark is a procedure, not a dashboard you glance at. Follow these steps in order, and watch for the slip attached to each one.
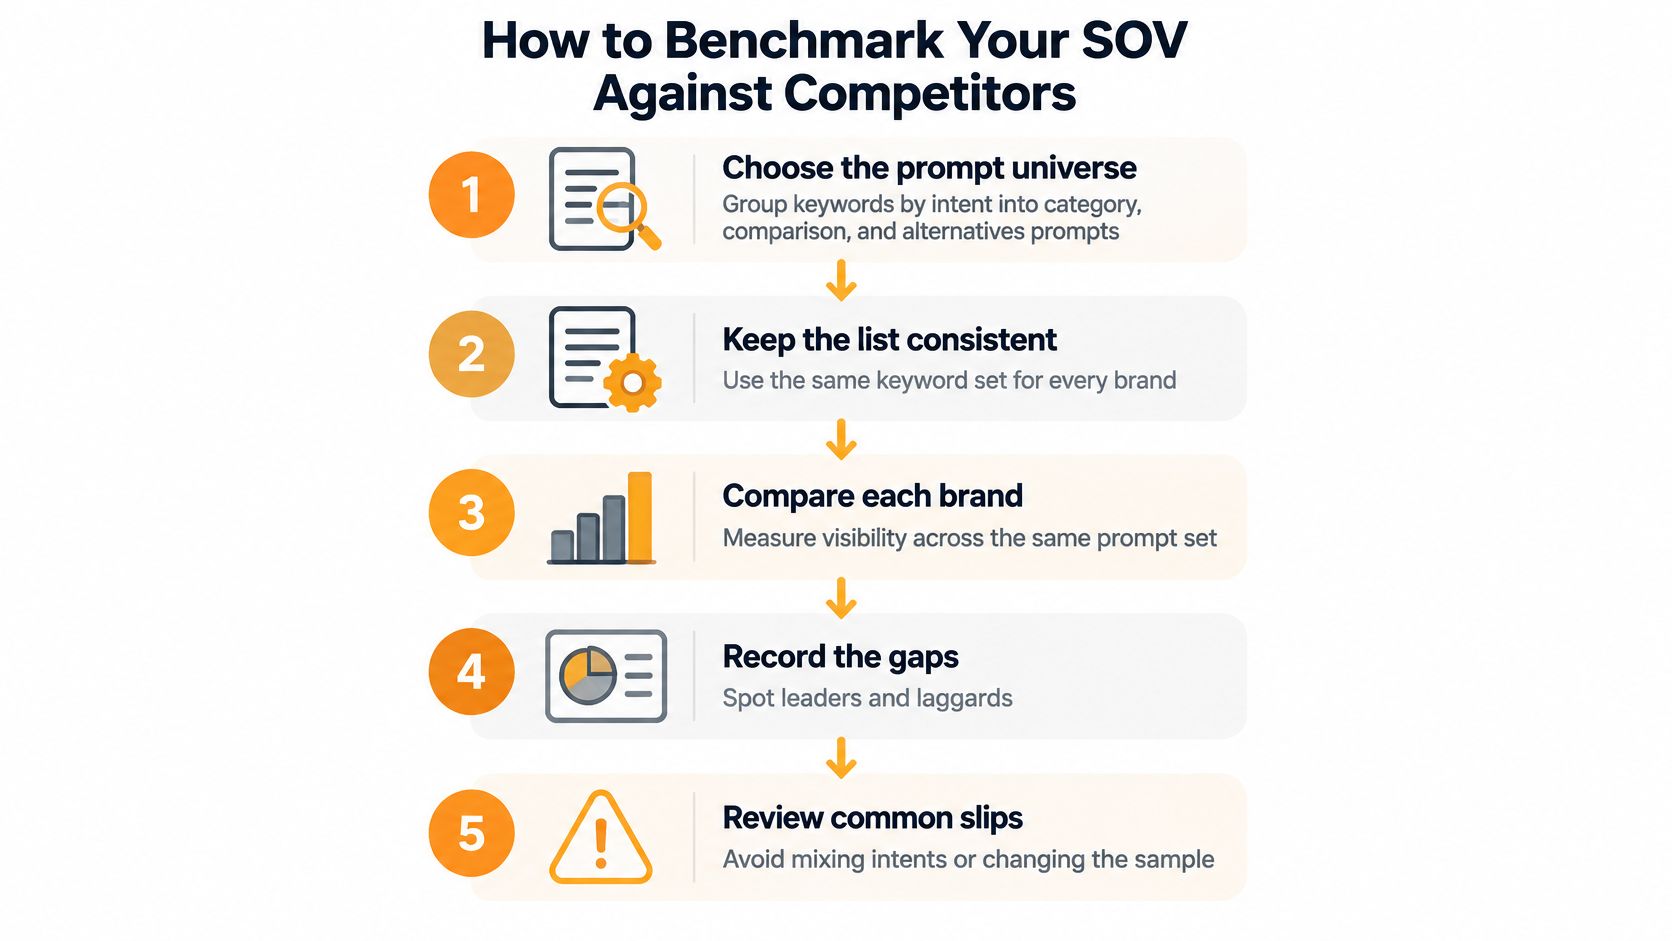
- Choose the prompt universe. Group keywords by intent into category, comparison, and alternatives prompts, and keep the list in writing. The common slip is adding prompts partway through a period, which changes the denominator.
- Name your competitor set. List your brand plus four to six named competitors, as a planning rule of thumb. Leaving out a rival who appears often in answers inflates everyone's share, including yours.
- Fix channel, engine, country, language, and period. Comparing one engine's results this month with another's last month tells you about engines, not brands.
- Count qualifying mentions for every brand. Use the same prompts and the same counting rules for each. Partial counting is where benchmarks break.
- Divide each brand's mentions by the total and multiply by 100. Check that all shares together make sense against the total you counted.
- Compare periods in percentage points. Moving from 20% to 25% is a 5 point gain. Reporting it as a 25% increase without labeling it as relative change confuses every reader and inflates the story.
- List the gaps. Record prompts where competitors are named and you aren't, plus which sources those answers cite. That list becomes your content and outreach queue.
Say an agency manages three clients in different categories. It runs one stable prompt set per client and reports SOV side by side each cycle, so every client's denominator stays comparable. Agencies and SEO teams can use LLMrefs to report AI visibility and share of voice for multiple clients in exactly that rhythm. For the broader method behind step seven, our walkthrough on how to do competitive benchmarking shows how to turn gaps into priorities.
You know the benchmark is healthy when three things are true. The denominator is stable, the leading brands are clearly identified, and you have a short list of prompts where you're missing.
Levers That Raise AI Share of Voice
Measurement only earns its keep if it tells you what to fix. Three levers cover most situations, and each fixes a different kind of gap.
Match prompts to buying intent. A 2026 stage-model study found that 78.3% of commercial prompts triggered search fan-out, compared with only 3.6% of informational prompts, according to the stage-model research on arXiv. Models gather and compare external evidence far more often for purchase questions, so weight your benchmark toward commercial prompts and track informational ones separately. A best project management software prompt feeds pipeline. A definition query mostly feeds awareness.
Check crawlability before editing content. Google's documentation on AI features in Search states that its generative systems use publicly accessible, crawlable content, and that sites don't need special AI text files or new schema to appear, though structured data should match visible page content. Say a product company wants its documentation cited. First confirm those pages are public and indexable. Then check whether they answer the comparison prompts buyers ask.
Match the lever to the gap. Missing from a prompt entirely? That needs content covering the question. Cited rarely? That needs source work so answers have evidence to pull from. Named but listed last? That needs stronger, clearer coverage of your differentiators. Paid media shifts the ratio too. In a hypothetical example, spending $3M against $8M of competitor spend gives you 27.3% of an $11M total, but only while the category total stays put.
Set Your SOV Baseline Before Your Next Review
One action matters before your next reporting cycle: set a baseline you can repeat. Everything after that is comparison against it.
- Choose one starting channel. Pick AI answers or paid media, whichever your business is judged on.
- Fix the inputs in writing. Category, competitor list, and prompt set go into your tracker today, not from memory later.
- Run the baseline over a set window. Record SOV, ESOV, and the AI metrics for every brand in the set.
- Schedule the rhythm. A monthly check catches drift. A quarterly review is where you judge direction and reallocate effort.
Use a simple decision rule at each review. If ESOV is negative and falling, work the prompts where competitors are named and you're absent. If SOV is strong but recommendation share is weak, focus content on earning explicit recommendations rather than more mentions. LLMrefs benchmarks a brand's performance against competitors using share-of-voice metrics, aggregates responses across multiple prompts and engines, and normalises and weights results to avoid outliers. All accounts can also set up unlimited projects to monitor multiple brands or domains, each with its own visibility tracking.
Close the task today. Write the baseline date, the denominator, and the first review date in your team tracker.
Set your fixed prompt set and competitor list, then use LLMrefs to track mentions, citations, positions, and share of voice across AI answer engines against that same denominator every cycle. You'll see exactly which prompts name competitors instead of you, so your next review starts from evidence rather than screenshots.
Related Posts

November 5, 2026
How to rank #1 for "apples": an SEO case study
A Connecticut grocer's blog post ranks

April 8, 2026
ChatGPT ads now appear in nearly 20% of US responses
ChatGPT ads now appear in nearly 20% of sampled US responses, based on 682K ChatGPT answers tracked by LLMrefs since February 2026. See who is buying, how fast ads are growing, and how we measure it.

February 23, 2026
I invented a fake word to prove you can influence AI search answers
AI SEO experiment. I made up the word "glimmergraftorium". Days later, ChatGPT confidently cited my definition as fact. Here is how to influence AI answers.

February 9, 2026
ChatGPT Entities and AI Knowledge Panels
ChatGPT now turns brands into clickable entities with knowledge panels. Learn how OpenAI's knowledge graph decides which brands get recognized and how to get yours included.