competitive benchmarking, benchmarking guide, competitor analysis, KPI tracking, marketing strategy
How to Do Competitive Benchmarking Right (2026 Guide)
Written by LLMrefs Team • Last updated October 7, 2026
You've pulled competitor pricing, tracked their rankings, saved screenshots of their landing pages, and perhaps even asked an AI engine which brand it recommends. Yet when leadership asks what the business should do differently, the spreadsheet offers no clear answer. The problem usually isn't a lack of data. It's that the benchmark was built around visible activity instead of a decision.
Competitive benchmarking works when it explains a performance gap and identifies the operating practices behind it. That principle matters even more in AI search, where a brand can be cited without being mentioned, appear in one answer engine but not another, or seem to lead because a handful of prompts happened to produce favorable responses. A useful benchmark measures the outcome, tests its stability, and gives the team a practical next move.
Why Most Benchmarking Efforts Fail Before They Start
A common benchmarking session starts with a large spreadsheet. One marketer records competitor rankings, another copies pricing details, and someone else collects social engagement figures. After several hours, the team has plenty of observations but no agreement on which gap matters. A competitor may have more followers or more indexed pages, but neither fact explains whether your business is losing qualified demand.
That's how vanity metrics consume strategy. Teams compare whatever is easy to find rather than what connects to a business decision. If the core concern is declining conversion from high-intent searches, raw follower counts won't explain the problem. A benchmark should begin with a question such as, “Why does this competitor receive more recommendations for our priority buying situations?” The answer may involve content relevance, third-party coverage, product proof, or the wording used in the answer itself.

The Xerox lesson
Competitive benchmarking became a formal management practice at Xerox in 1979, after Fuji-Xerox in Japan compared Xerox products, quality, and manufacturing costs with Japanese competitors. The analysis found that Xerox's U.S. manufacturing costs were so high that competitors could sell comparable machines at prices close to Xerox's own production cost. The historical account of Xerox benchmarking shows why the company moved beyond product comparisons and examined processes, quality, staffing, purchasing, and operations.
The useful lesson isn't to imitate Xerox's manufacturing study. It's to diagnose the mechanism behind the gap. In AI search, that means looking beyond “Competitor A has higher visibility” and asking which sources receive citations, what claims appear in the narrative, which buyer intents produce the difference, and whether the result repeats across engines and dates.
Practical rule: Never collect a competitor metric unless you can name the decision it may change.
A weak benchmark also mixes incompatible comparisons. It combines branded and non-branded queries, different countries, different customer segments, and changing prompt wording, then presents the result as one leaderboard. That creates false precision. Start with a defined performance gap, a stable comparison scope, and a small set of outcomes that someone can act on.
Defining Your Benchmarking Framework
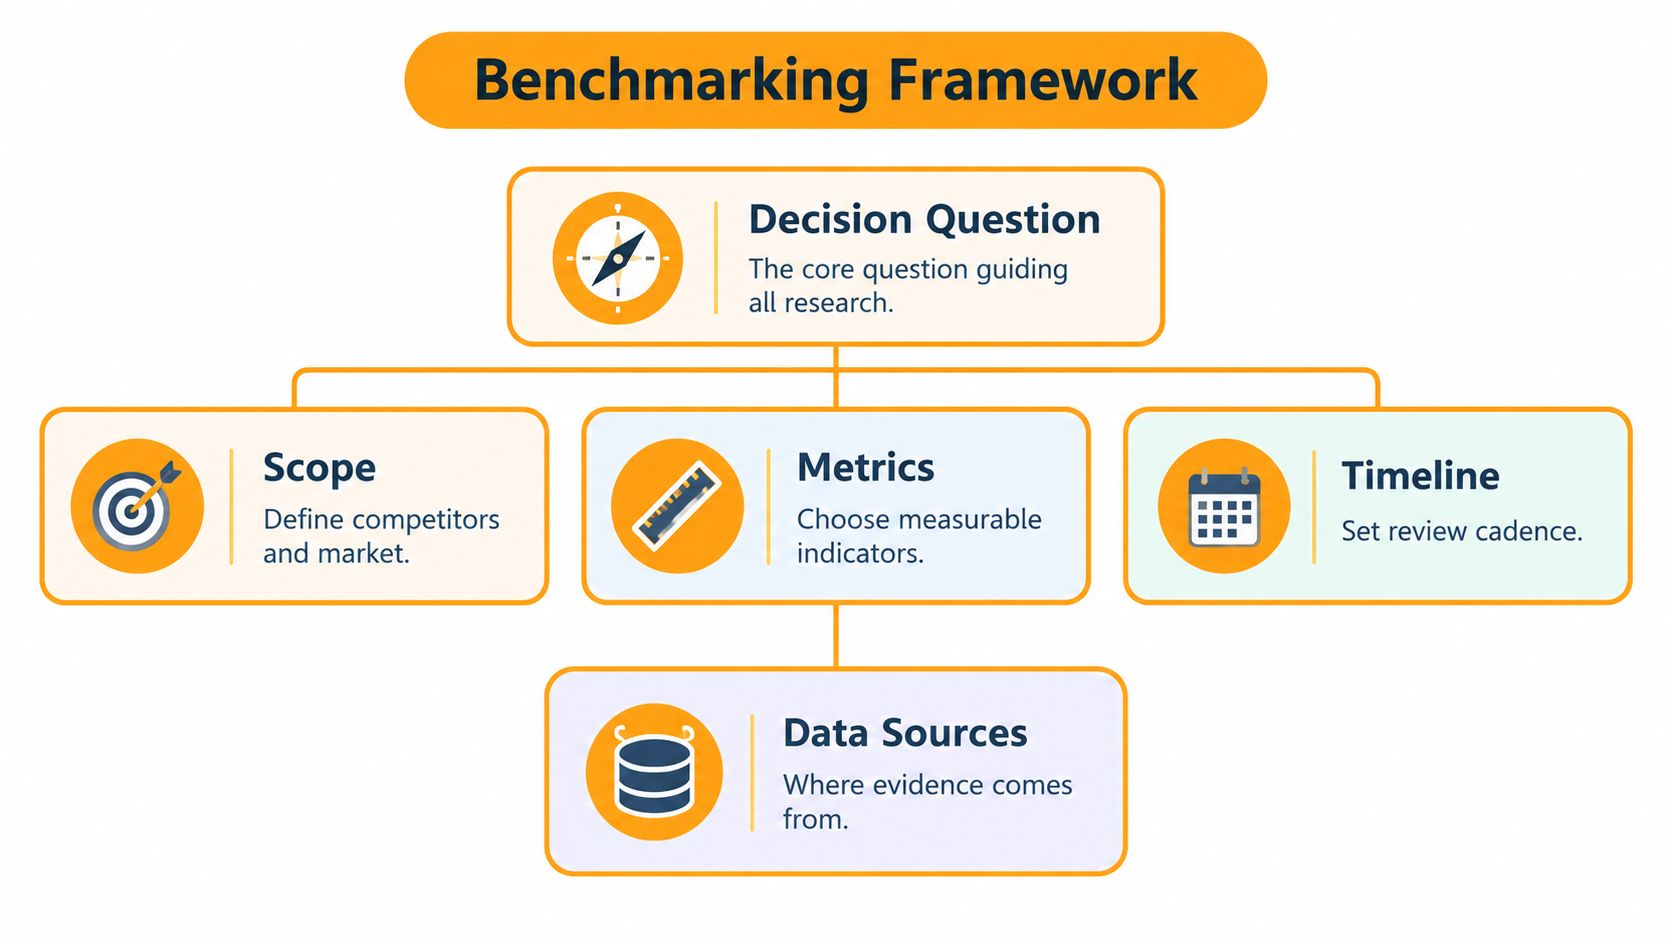
Before collecting data, write the decision question in one sentence. “How visible are competitors?” is too broad. “Which competitors are recommended most often for non-branded software evaluation queries in our priority market, and which source types support those recommendations?” is specific enough to guide collection and analysis.
Turn that question into a KPI tree. An outcome such as AI-search share of voice can branch into mention rate, citation rate, answer position, source relevance, and intent segment. A commercial outcome can also be expressed as a driver tree, such as revenue = traffic × conversion rate × average order value. The tree prevents the team from treating a headline metric as an explanation.
Define the measurement contract
Write a short specification for every metric before anyone gathers it. A defensible study should document the numerator, denominator, observation window, currency, inclusion rules, and data vintage, as recommended in this benchmarking framework from Umbrex.
For an AI-search metric, the specification might say:
- Mention rate: responses that name the brand divided by all valid responses in the fixed sample.
- Citation rate: responses that cite an identified source associated with the brand divided by all valid responses.
- Position: the brand's placement in a response, using a consistent rule for ties and absent brands.
- Source relevance: whether the cited page directly supports the claim made about the brand.
- Comparison scope: fixed keywords, model, region, language, intent, and collection cadence.
These definitions matter because two analysts can otherwise calculate “visibility” in different ways and both believe they're correct.
Build a comparable peer set
Select approximately 8–20 peers using business model, price tier, channel mix, geography, and customer segment. Include direct competitors, functional peers with similar go-to-market mechanics, and best-in-class examples from another category when their operating practice is relevant. A self-service company may provide a useful activation benchmark for enterprise software, even if it isn't a direct rival.
Fix exclusions before collection begins. Record why a company was included, which peers were removed, what sources were used, and how estimates were transformed. That audit trail makes the benchmark reproducible and keeps the team from changing the comparison group after seeing the results.
Choosing Metrics That Actually Matter
A strong benchmark uses between five and eight primary metrics, with each metric documented so two analysts would calculate the same number. The guidance on selecting core benchmarking measures also recommends recording the baseline, data vintage, comparison scope, relative gaps, quartiles or deciles, and trends.
For AI-search benchmarking, a practical core set could include:
- Share of voice, the proportion of valid answers in which a brand appears within the defined competitive set.
- Brand-mention rate, which captures whether the answer names the entity, not merely one of its sources.
- Citation rate, which measures how frequently relevant sources connected to the brand are cited.
- Answer position, using a documented rule for where recommendations or mentions appear.
- Competitor gap, showing the relative difference between your result and a selected peer.
- Source relevance, assessing whether the cited page supports the answer's claim.
- Narrative accuracy, checking whether the model describes the product, category, and differentiators correctly.
The first five are easier to trend. The final two explain quality and risk. A brand can receive citations from pages that are outdated, irrelevant, or misleading, so a citation count alone can reward the wrong outcome.
Pair outcomes with process measures
Outcome metrics tell you what happened. Process metrics help explain why. For a SaaS company, outcome measures might include conversion, retention, or customer satisfaction. Process measures could include onboarding touchpoints, support response time, release frequency, or the clarity of product documentation.
The same logic applies to AI visibility. If a competitor wins recommendations, inspect the pages, reviews, forums, and documentation cited in those answers. Record source type, page relevance, claim coverage, and factual framing. This turns “the competitor is mentioned more often” into a hypothesis such as, “Independent comparison pages explain this use case more clearly than our owned content.”
Avoid raw rankings without context. A rank can hide a narrow keyword mix, a strong branded cohort, or a single unusually favorable response. For a deeper treatment of this metric, use share of voice measurement as part of a broader KPI system rather than treating it as the entire benchmark.
Selecting and Comparing Your Competitors
Competitor selection should reflect how customers choose, not only how your internal team categorizes the market. Start with direct rivals, then add alternatives that solve the same problem differently. Include a best-in-class exemplar when it demonstrates a process your team wants to learn, even if it sells to a different audience.
A B2B software company might compare direct rivals on entry positioning, onboarding experience, conversion, retention, and support response time. It could then study a leading self-service company for activation and product education. The purpose isn't to declare one universal winner. It's to identify which practices belong in your own operating model.
| Peer Type | Selection Criteria | Examples |
|---|---|---|
| Direct competitor | Similar product, buyer, price tier, and sales motion | A rival targeting the same customer segment |
| Functional peer | Similar go-to-market mechanics or customer journey | A self-service company with strong activation |
| Indirect competitor | Different offer solving the same customer problem | An alternative workflow or service |
| Best-in-class exemplar | Demonstrated strength in a relevant process | A company known for clear onboarding |
| Substitute | Different behavior that can replace the category purchase | An internal process or manual workaround |
Normalize before comparing
Align the variables that can distort a result:
- Time period: Compare the same observation windows and account for seasonality.
- Customer mix: Separate enterprise, mid-market, and smaller accounts when their behavior differs.
- Channel mix: Don't compare a partner-led company with a self-service company without labeling the distinction.
- Price structure: Distinguish monthly and annual offers, included features, mandatory fees, and discount conditions.
- AI-search settings: Keep model, region, language, keyword cohort, prompt generation, and sampling cadence stable.
Survey and tracking data need the same discipline. A practical minimum for survey-based competitive intelligence is about 100 respondents per segment for roughly a ±10-percentage-point margin of error, while tracking studies generally need 200 or more respondents per wave to detect changes of about 5 percentage points. These benchmarks are summarized in the competitive intelligence survey guidance from Koji. For AI answers, the equivalent concern is repeated observations in each keyword, model, and geography cell.
A useful companion to your internal process is this guide to conducting a competitor analysis, particularly when you need to broaden research beyond search visibility. For tool selection, compare platforms by the evidence they expose, not just the number of dashboards they provide. A practical overview of competitive intelligence tools can help frame that evaluation.
Measuring with Confidence and Statistical Rigor
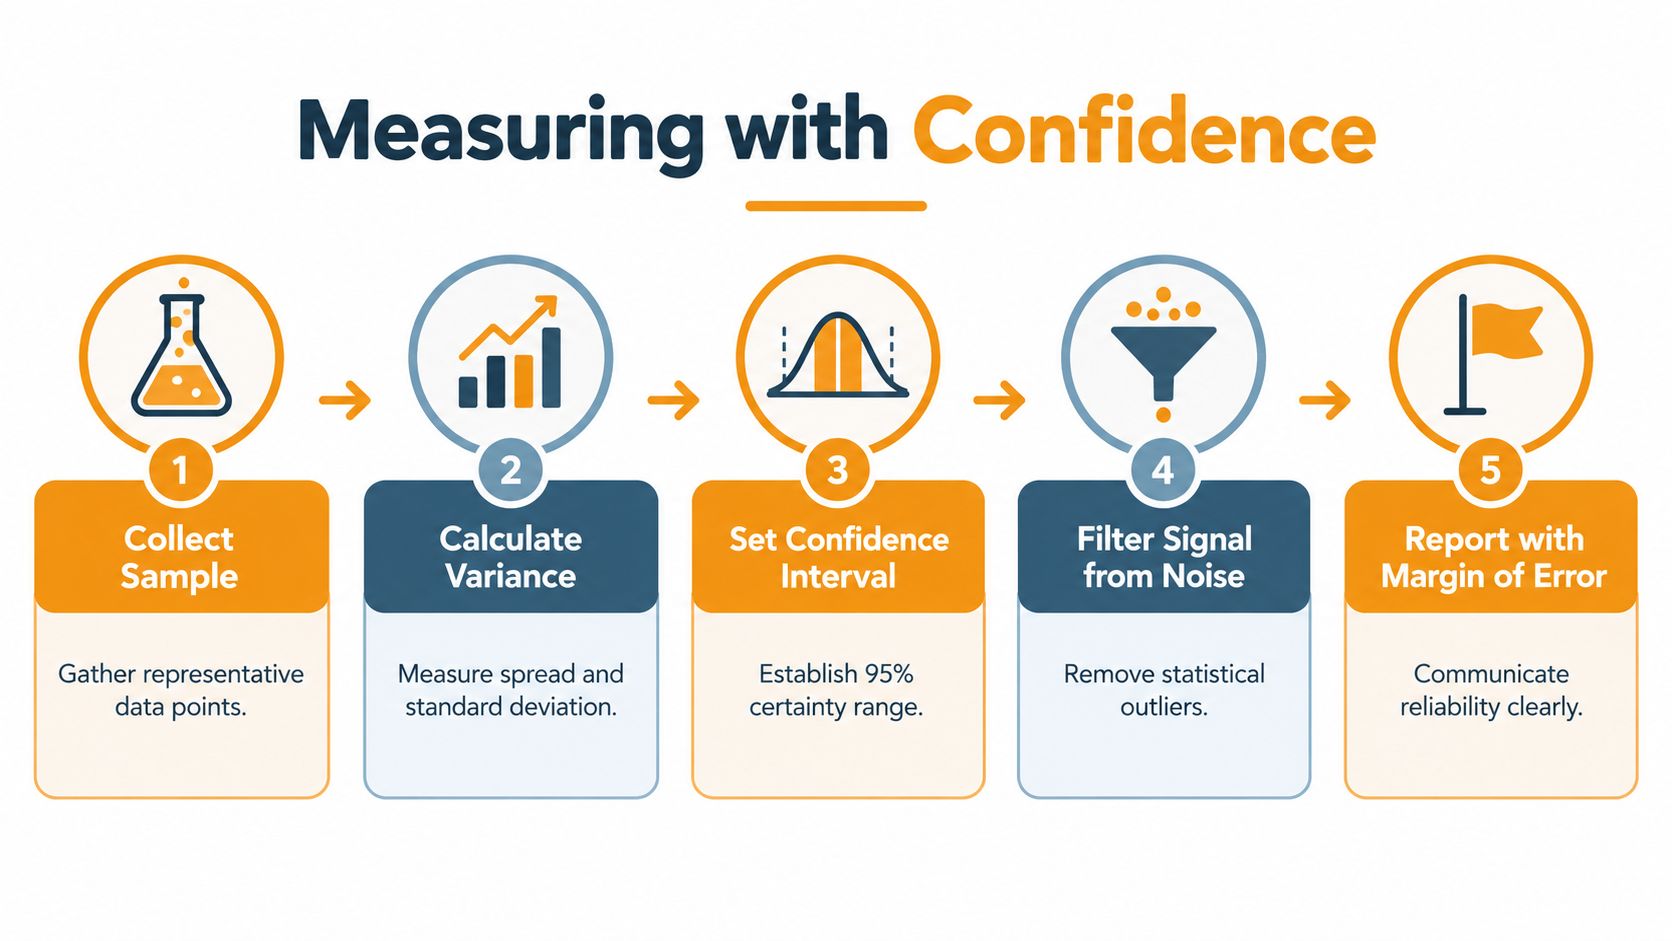
A benchmark needs more than a point estimate. It must show how much the result could change if the measurement were repeated. That uncertainty matters in AI search, where answer wording, cited sources, and brand mentions can shift across similar prompts.
Use a fixed sampling frame and collect observations across multiple dates. Analyze results by intent, language, geography, and engine before combining them. A pooled score can hide meaningful differences when one model produces concentrated citations and another distributes them widely. Report engine-specific baselines first, then document the weighting rule behind any aggregate score.
Separate statistical and commercial decisions
Statistical significance and business importance answer different questions. A commonly used threshold is alpha = 0.05, representing a 5% risk of treating random variation as a real effect and corresponding to a 95% confidence level. The benchmarking significance guidance notes that a statistically detectable difference may still be too small to matter commercially.
Set a minimum effect of interest before examining results. Decide, for example, that a competitor lead must persist across multiple measurement periods and exceed a defined visibility gap before it starts a content or outreach project. A small detectable difference may have no effect on customer acquisition. A moderate gap in a high-value intent group may justify immediate investigation.
Before setting that threshold, review sample-size considerations for guidance on determining adequate observation counts and defining a meaningful minimum effect.
A reliable dashboard should display:
- Estimate: The observed mention rate, citation share, or position.
- Sample size: The number of valid observations supporting the estimate.
- Uncertainty interval: The range around the estimate.
- Change over time: The period comparison under identical definitions.
- Peer percentile: Relative standing within the documented comparison set.
- Confidence flag: Whether the difference passes the predeclared test.
A benchmark should show who appears to lead and whether the evidence supports changing course.
Audit the dataset for duplicated observations, outliers, seasonal effects, and Simpson's paradox, where an aggregate trend reverses after segmentation. Retain the full peer list, exclusions, source confidence, and transformation rules. That record turns a persuasive chart into a measurement system that analysts can defend and repeat.
Turning Insights into Action with AI-Search Benchmarking
Manual AI-search checks are useful for discovering questions, but they're a weak foundation for an ongoing benchmark. A marketer can run a few prompts in ChatGPT, Perplexity, Google AI Overviews, Claude, Gemini, Grok, or Copilot and see different answers each time. Those snapshots create awareness, not a reliable baseline.

Set up a keyword-based comparison scope instead. Group keywords by buyer intent, generate conversational variations, and preserve the resulting prompt panel. Then collect responses repeatedly across the selected engines and markets. Track share of voice, citations, mentions, position, source type, and competitor gaps together, because each metric answers a different question.
A competitor may be cited but not named. Another may be named frequently but supported by weak or irrelevant sources. A third may appear near the beginning of recommendations for one intent and disappear for another. The benchmark should capture those differences rather than flattening them into a single rank.
The research gap is methodological. Many guides explain how to collect competitor scores but not how many observations are needed before a difference is meaningful, how to handle volatile answers, or how to distinguish a real shift from sampling noise. The research on stability and confidence in AI search measurement supports treating repeated observations and stability as core dimensions, not optional extras.
A platform such as LLMrefs can aggregate AI responses, citations, mentions, and position data across defined keyword scopes, models, and markets. It also lets teams inspect cited sources, which helps connect a visibility gap to a content or outreach hypothesis. If you're comparing approaches, you can also browse AI-powered SEO tools from 1stNet AI to understand the wider tool ecosystem.
The practical workflow is straightforward: find the gap, verify that it repeats, inspect the answer narrative and cited sources, then assign an owner to the response. That response might involve improving a comparison page, correcting entity information, publishing evidence for a disputed claim, or earning relevant third-party coverage. The benchmark earns its place in the marketing stack only when it changes what the team does next.
Your Action Plan for Effective Benchmarking
Start with a decision question and write down the performance outcome it concerns. Build a KPI tree, choose five to eight primary metrics, define each calculation, and freeze the keyword, peer, market, and time scope before collecting observations.
Next, create a compact data dictionary. For every metric, record its definition, source, unit, observation window, inclusion rules, confidence level, and owner. This prevents a familiar failure mode where one analyst counts every brand appearance while another counts only recommendations.
Choose peers based on customer substitution and operating similarity. Include direct rivals, functional peers, and a best-in-class reference where it adds learning value. Normalize customer mix, channel mix, pricing structure, seasonality, and AI-search settings before comparing results.
Then establish the measurement routine:
- Collect consistently: Use the same keyword cohorts, engines, markets, and sampling rules.
- Review uncertainty: Show sample size, intervals, changes, and significance flags beside every headline metric.
- Investigate causes: Inspect cited pages, source types, claims, and answer position.
- Prioritize actions: Select changes tied to a meaningful gap and a practical business outcome.
- Document learning: Record what changed, when it changed, and whether the next measurement supports the hypothesis.
For a SaaS team, the first action might be improving evidence on high-intent comparison pages. For an e-commerce brand, it might be correcting product attributes and strengthening independent coverage. Don't expand the dashboard until the existing metrics are stable, understood, and connected to decisions.
LLMrefs helps brands, agencies, and SEO teams benchmark AI-search visibility through repeated keyword-based measurements, competitor comparisons, citations, mentions, share of voice, and position metrics across answer engines. Visit LLMrefs to turn scattered AI-search checks into a structured benchmarking workflow with evidence your team can act on.
Related Posts

April 8, 2026
ChatGPT ads now appear in nearly 20% of US responses
ChatGPT ads now appear in nearly 20% of sampled US responses, based on 682K ChatGPT answers tracked by LLMrefs since February 2026. See who is buying, how fast ads are growing, and how we measure it.

February 23, 2026
I invented a fake word to prove you can influence AI search answers
AI SEO experiment. I made up the word "glimmergraftorium". Days later, ChatGPT confidently cited my definition as fact. Here is how to influence AI answers.

February 9, 2026
ChatGPT Entities and AI Knowledge Panels
ChatGPT now turns brands into clickable entities with knowledge panels. Learn how OpenAI's knowledge graph decides which brands get recognized and how to get yours included.

February 5, 2026
What are zero-click searches? How AI stole your traffic
Over 80% of searches in 2026 end without a click. Users get answers from AI Overviews or skip Google for ChatGPT. Learn what zero-click means and why CTR metrics no longer work.