measure AI visibility, AI visibility, AI citations, share of voice, GEO metrics
How to Measure AI Visibility: Metrics and Method
Written by LLMrefs Team • Last updated November 18, 2026
Research on generative engine optimization has found that adding quotations, statistics or citations can noticeably raise how often a page is named in AI-generated answers, so the levers for getting named are knowable. Proving that your last change worked is the harder problem.
A screenshot of a chatbot naming a brand, taken once and pasted into a deck, records a moment. It does not record a trend. Five prompts run once a month will swing on model randomness alone. Nobody reading that deck can separate a real gain from a reroll.
I would rather defend a frozen prompt set, a stated sample size, and segments by engine and country than a prettier chart of the same one-off answers. Mention counts only become useful once you can trace answer presence through to traffic and revenue. Get that chain right and AI visibility stops being a dashboard shopping decision. It becomes a reporting discipline a team can stand behind in a client review.
Four Metrics That Define AI Visibility
| Metric | Formula | Example | What it tells you |
|---|---|---|---|
| Mention rate | Answers naming the brand / tested answers | 42 of 100 = 42% | Whether AI systems know the brand exists for the query |
| Citation share | Answers citing your domain / relevant answers | 18 of 100 = 18% | Whether your pages are used as evidence |
| Citation position | Where your domain sits in the cited source list | Listed first of four sources | Whether you are among the first sources read |
| Share of voice | Your mentions / all tracked brand mentions | 24 of 80 = 30% | How you rank against named competitors |
Mention rate answers the question every stakeholder asks first. Divide the answers that name your brand by the answers you tested. It's the cheapest number to collect and the easiest to over-read, because a model can name you in a list of ten and still send nobody anywhere.
Citation share is the metric content teams should report. Citation and mention are separate events. A model can name a brand from training data without linking to its pages, and it can cite a page without ever naming the company that owns it.
Citation position records where your domain falls in the source list, first of four versus fourth of four. Citation prominence is the qualitative companion: whether your page supports the central claim of the answer or is dragged in for a minor detail. A first-position citation that contradicts the summary is worse than no citation.
Share of voice puts competitors in the denominator. Your mentions divided by every tracked brand mention across the sample gives a competitive number rather than a self-referential one.
The reason citation metrics deserve equal billing is structural. Pew Research Center's analysis of browsing activity from 900 U.S. adults in March 2025 found that 18% of all Google searches produced an AI-generated summary, and among those summaries 88% cited three or more sources while only 1% cited a single source (Pew Research Center). When nearly nine in ten answers assemble a panel of sources, a top-ten ranking tells you nothing about whether you're in the panel.
Demand for that split shows up in practice. In a 2025 SEOFOMO survey, 79% of respondents named brand visibility or mentions in relevant AI answers as a key AI-search metric, and 64% tracked whether their brand was included among cited sources (SEOFOMO). Report mention rate and citation share side by side, because each one alone hides the failure mode that matters.
Report them in pairs. A brand at 60% mention rate and 8% citation share is talked about but not used as evidence. That's a different problem from a brand at 20% and 20%, and it needs a different fix.
If you only have room for one number, pick by audience: citation share for content teams who can act on it, share of voice for competitive reviews where leadership wants to know who is winning.
How Many Runs Make a Visibility Change Real
A gain from 28% to 36% week over week reads like progress. On a 100-prompt sample it usually isn't. The arithmetic settles the argument before any tool gets opened.
| Prompts tested | Margin of error | Reliable for |
|---|---|---|
| 25 | plus or minus 20 points | Directional checks only |
| 100 | plus or minus 10 points | Monthly benchmarking by engine |
| 400 | plus or minus 5 points | Client reporting across markets |
Those bands come from the standard error of a proportion near 50% at 95% confidence. An eight-point move on 100 prompts sits inside the band, so the honest report is "no significant change this month." At 25 prompts the band is so wide that almost any movement is noise.
A single run fails for reasons beyond sample size. Model randomness reshuffles answers. Personalization and geography change which sources get pulled. Language changes the competitive set entirely. Small wording edits ("best tool for X" versus "what's the best tool for X") can name a different brand.
Practical rule: run your revenue-critical prompts at least three times, log the spread between runs, and publish the range rather than a single percentage.
Citation patterns also move against conventional rankings, so one aggregate score hides behavior that changes by engine and by month. A study of 1 million Google AI Overviews and 1.9 million citations found that 76% of cited pages appeared in the conventional top 10 in July 2025, while later reporting on the same research found only 37.9% of AI Overview citation URLs in the first 10 results (Ahrefs analysis of search rankings and AI citations). Treating AI visibility as a re-skin of rank tracking, built on the earlier number, reports a world that has moved.
Brand mentions are the input worth protecting. A 2025 analysis of 75,000 brands, as reported in a DreamHost write-up of brand mentions, found branded web mentions correlated with Google AI Overview visibility at 0.664, against 0.218 for backlinks. Correlation isn't causation, but the gap is wide enough that link-only reporting misses most of the signal.
When you decide between two numbers, check whether the difference survives the margin of error. That's the whole test. A dramatic weekly gain from an unstable sample becomes a liability in a client meeting, because leadership will treat a noisy mention rate as a revenue story. Stable, comparable metrics do more for a report than another chart does, and planning sample size before you start is the cheapest way to get them. LLMrefs re-checks prompts continually for statistical significance, so teams see stable, comparable visibility metrics instead of one-off screenshots.
How to Run a Repeatable Visibility Check
The routine below takes an afternoon to build and about an hour a week to keep running. The order matters more than the tooling.
Above is the whole process in one view, and the steps below explain what each one prevents.
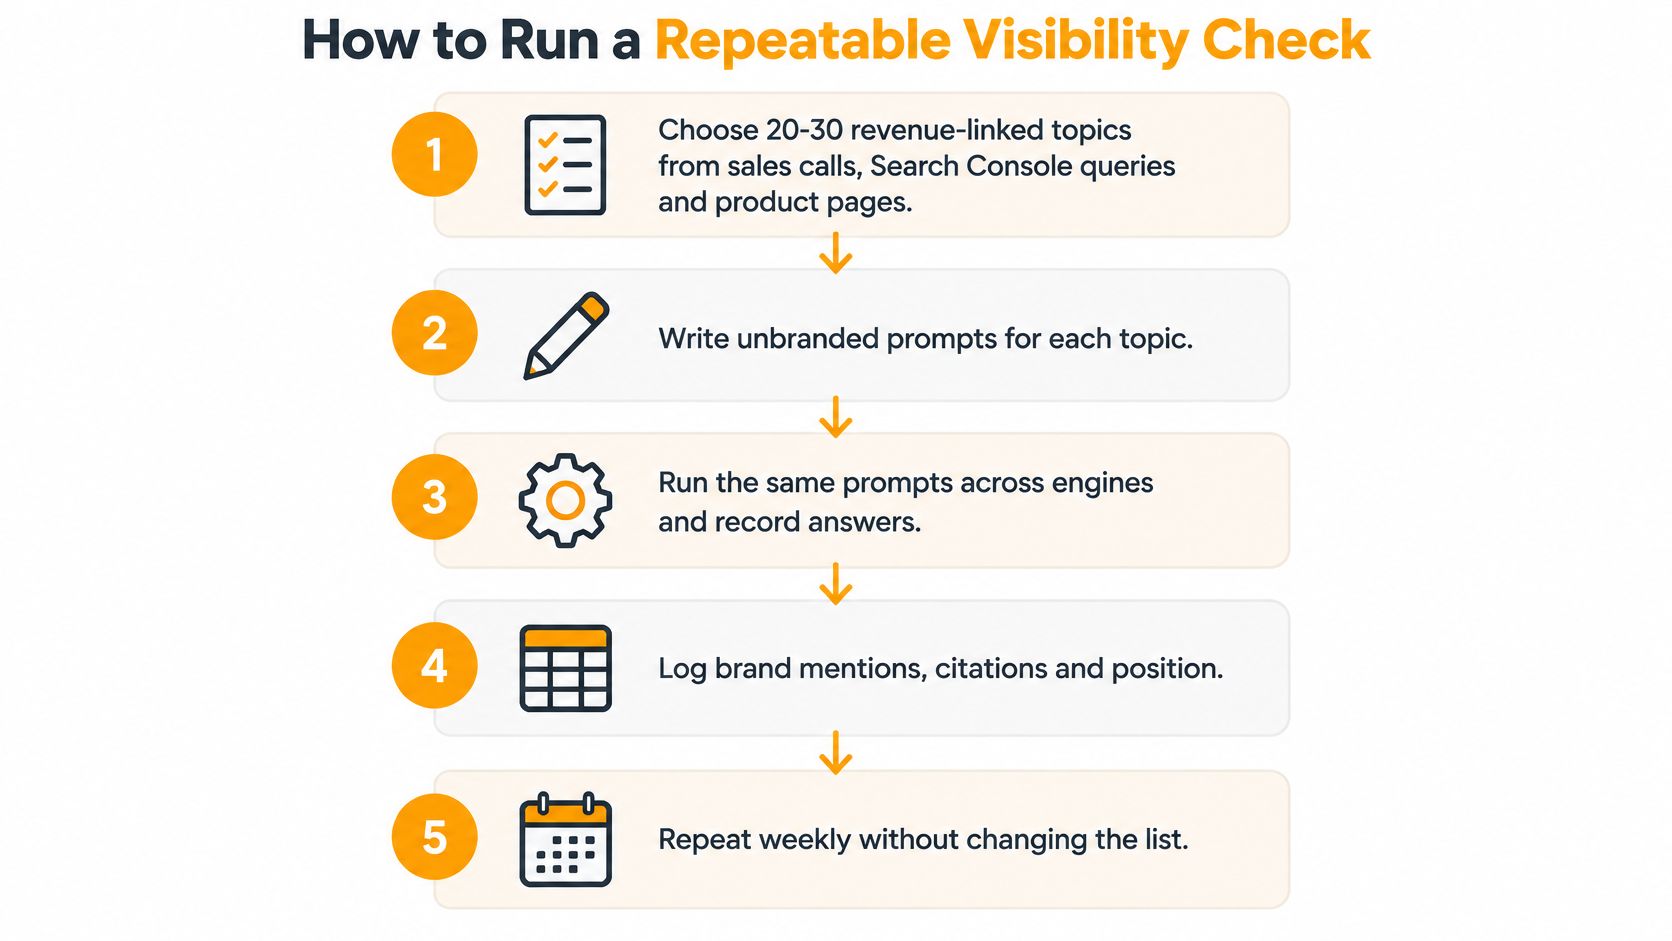
- Pull 20 to 30 revenue-linked topics. Sales call notes, Search Console queries, and product pages reveal which topics buyers care about. Keyword tools show which topics other SEOs care about. Write 50 to 100 conversational prompts across those topics, mixing "best X for Y," "X versus Y," and transactional "how do I fix Z" phrasing.
- Tag every prompt branded or unbranded. A navigational search like "is [brand] legit" inflates mention rate without telling you anything about discovery. Keep branded prompts in a separate report.
- Freeze geography and language. Run the set in one market and one language, US English for American buyers, then repeat the whole set for the next market. Mixing them produces an average of nothing.
- Choose engines by buyer, not by novelty. ChatGPT, Google AI Overviews, Perplexity and Gemini cover most B2B evaluation journeys today. Record which engine produced which answer.
- Log four fields per answer. Mention, cited domains, citation position, and named competitors, plus the date. Everything else is derived.
- Rerun on the same weekday with the same list. If you edit prompt wording mid-test, the trend line becomes unreadable, and you'll spend the next quarter explaining a drop that was your own edit.
What the baseline file must contain
Nine columns are enough: date, engine, country, prompt text, branded flag, mentioned yes or no, cited domain, citation position, and competitor names. Everything in the four metrics above can be calculated from that sheet with a couple of COUNTIF formulas.
The failure this prevents is subtle. Teams edit prompts between weeks, then argue about whether a ten-point rise came from new content or from a softer question. Freeze the list and the argument disappears.
Say a project-management software brand tracks 60 unbranded US prompts across four engines, producing 240 answers a week. Citation share is filed by engine, so when Google AI Overviews stops citing the comparison page, the brand knows which engine moved and which page to fix. Ten prompts and a single engine would have produced the same story or its opposite.
LLMrefs handles prompt generation and variations, fan-out queries and grounding, then collects and analyses AI responses at scale, with results checked in real time. That turns the weekly run into a review of the answers rather than an afternoon of data entry.
Calculating Share of Voice by Engine and Intent
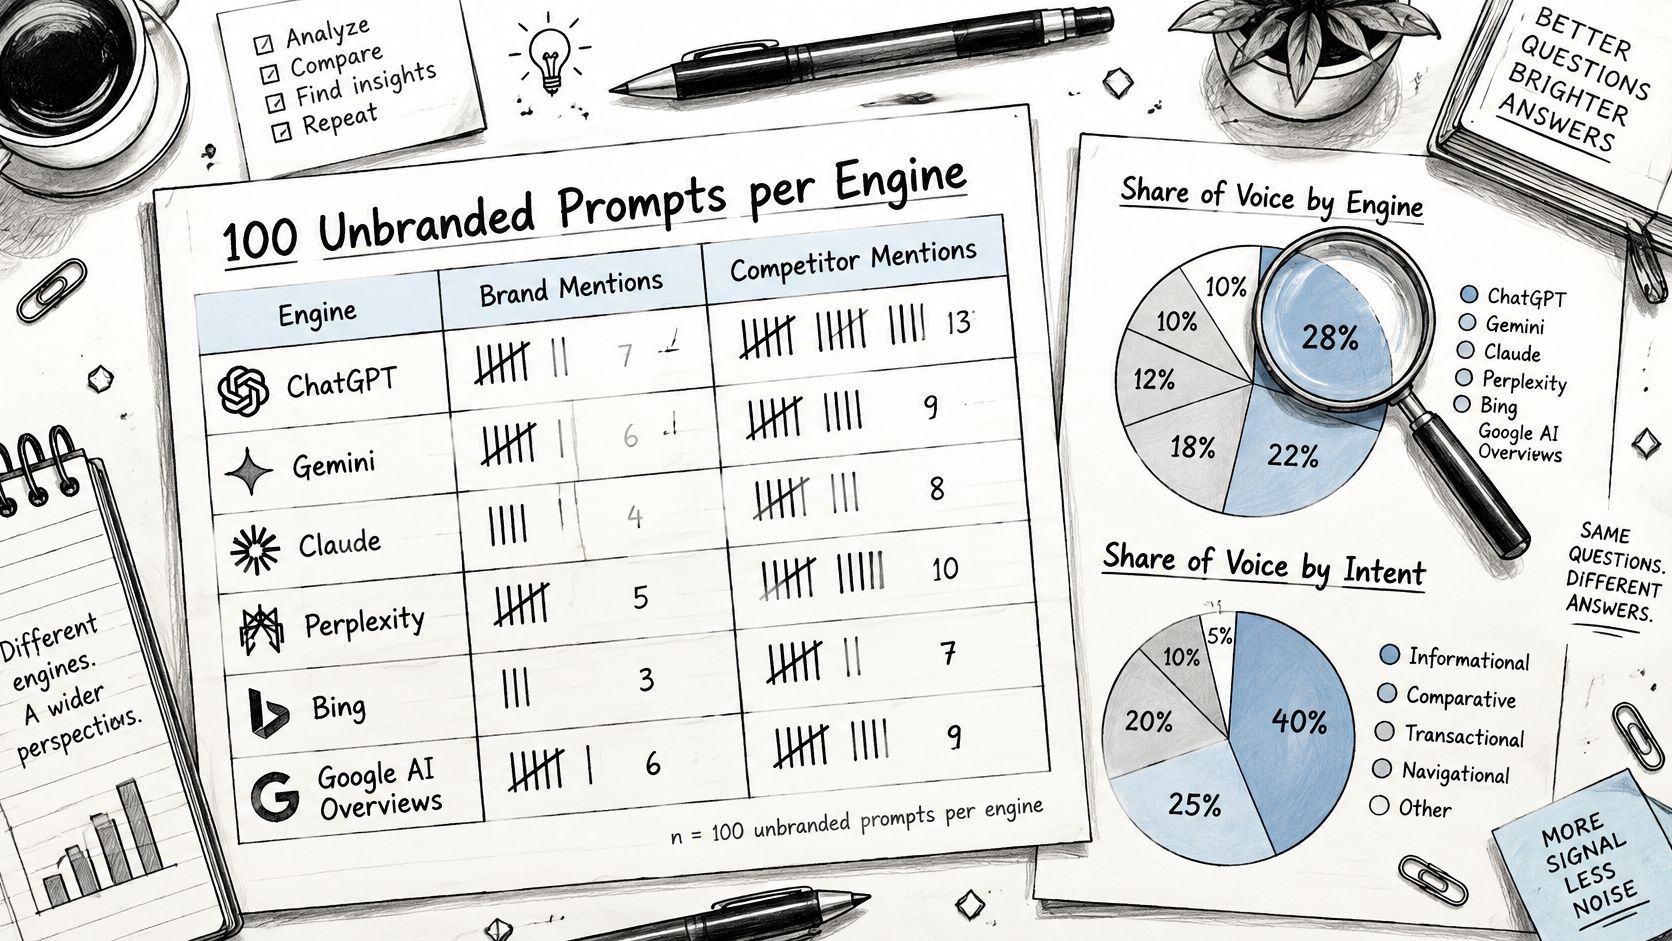
Raw answers become share of voice when you put competitors in the denominator. The table below runs 100 unbranded prompts per engine, with one brand mention counted per answer.
| Segment | Brand mentions | Competitor mentions | Share of voice |
|---|---|---|---|
| ChatGPT, unbranded | 38 | 62 | 38% |
| Perplexity, unbranded | 51 | 49 | 51% |
| Google AI Overviews, unbranded | 29 | 71 | 29% |
| All three engines, unbranded | 118 | 182 | 39% |
Take the ChatGPT row. The brand appears in 38 of 100 answers and competitors appear across 62, so 38 divided by 100 total mentions gives a 38% share. Perplexity runs 51 to 49, Google AI Overviews 29 to 71. Blended across all three, 118 brand mentions against 182 competitor mentions gives 39%.
Now remove Perplexity. The total drops to 67 brand mentions against 133 competitor mentions, or about 34%. One engine changes the headline by five points, which is why a blended company-wide share of voice reported without an engine breakdown is close to useless for decisions.
Segments diverge because engines retrieve differently. Perplexity leans on fresh third-party coverage and forum threads, Google AI Overviews leans on pages that already rank well, and the same prompt produces different competitive sets on each. The only way to see that is to keep the prompt list identical and split the report.
The benchmark also has to survive changing adoption. Stanford's 2025 AI Index reports that organizational AI use rose from 55% in 2023 to 78% in 2024, with reported generative-AI use in at least one business function more than doubling from 33% to 71% over the same period (Stanford HAI). A fixed, representative keyword set gives you a number that means something as that curve continues; a hand-picked handful of prompts gives you a number that means something about last Tuesday.
Report the sample size beside every percentage. A 60% share of voice built on 15 prompts is an anecdote with a percent sign.
Three reporting rules keep the trend honest. Show the prompt count next to every figure, keep query definitions, geography, language and engine categories fixed across periods, and split intent so awareness prompts ("what is X") don't get averaged with purchase prompts ("best X for small teams"). Your standing template should hold date, engine, country, prompt count, brand share, top competitor share, and the change against the last period. If you want the definitions behind the metric before you build the sheet, this explainer on what AI share of voice measures covers the calculation end to end.
Linking AI Visibility to Traffic and Revenue
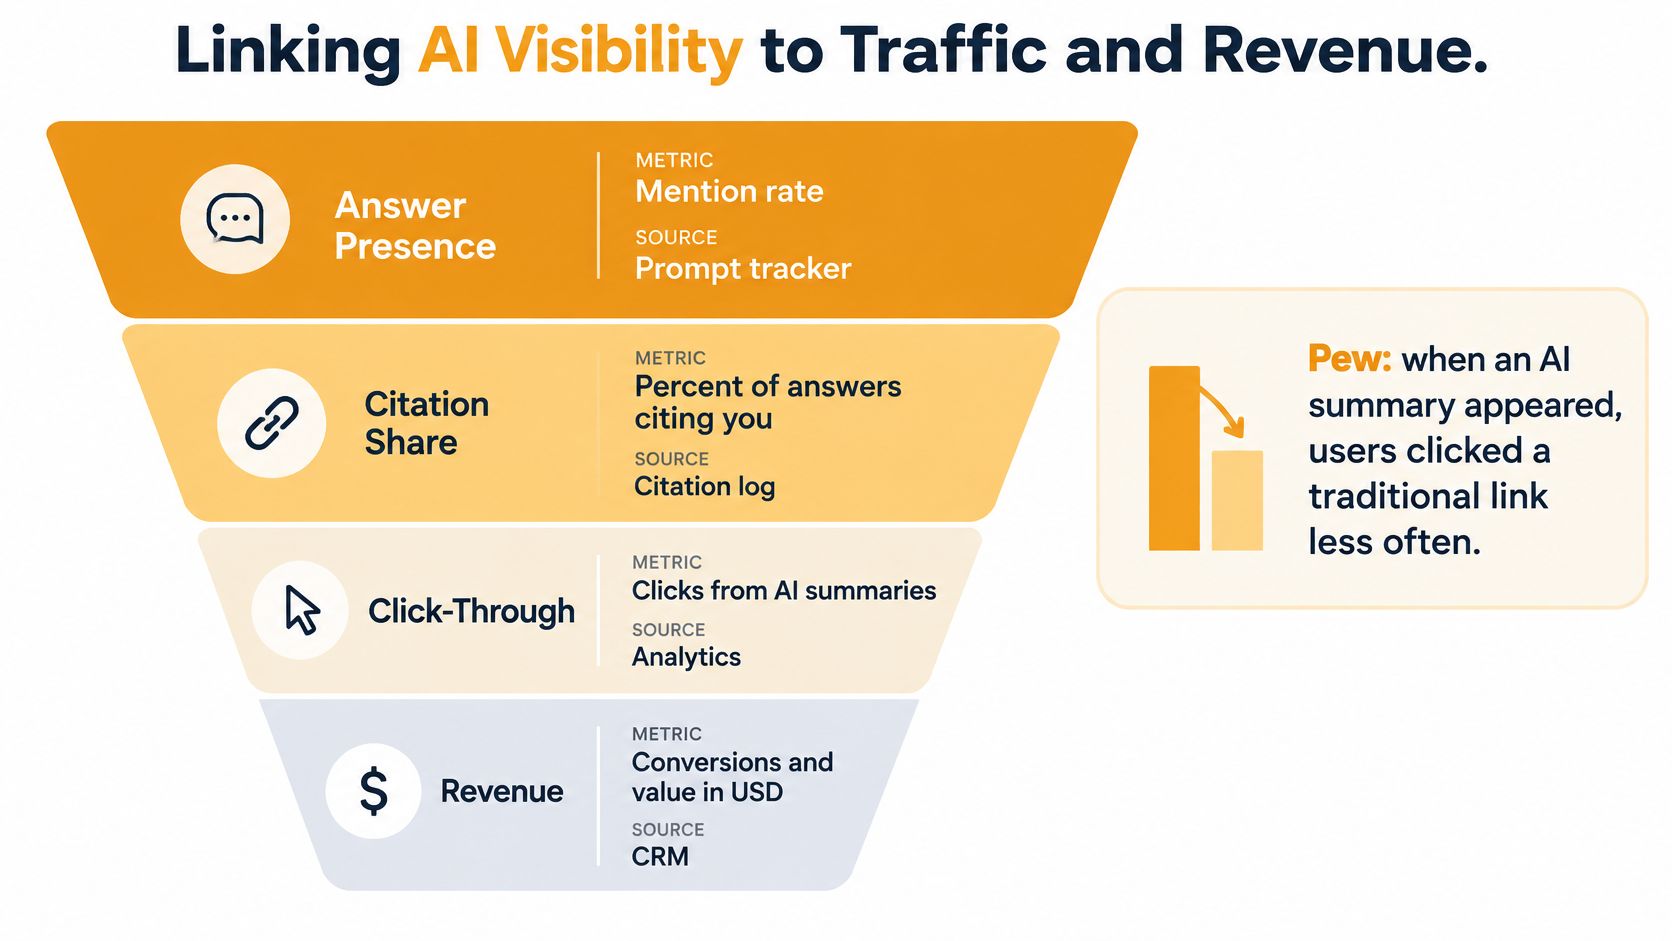
8%. That is how often users clicked a traditional result when an AI summary appeared, against 15% when it did not. Links inside the summary were clicked in 1% of visits. Pew Research Center measured this in a March 2025 study of 900 U.S. adults (Pew Research Center). Presence is the top of the funnel. Money is the bottom. Click-through sits in the middle and misleads if you read it alone, because many buyers never click and still show up later as a branded visit or a form fill.
Wire the stages below, and keep each one separate so a rise in mentions cannot be mistaken for a rise in revenue.
| Funnel stage | Metric | Where to pull it |
|---|---|---|
| Answer presence | Mention rate and share of voice | Visibility tracker across engines |
| Citation visibility | Citation share and citation position | Logged cited-source list |
| Referral visits | AI referral sessions | Analytics referral report |
| Assisted conversions | Conversions where an AI referral appears earlier in the path | Multi-touch attribution report |
| Revenue | Pipeline and closed revenue from AI-referred and branded visits | CRM with a source field |
A self-reported source field on demo and sign-up forms is what captures the buyers the click data misses. Ask where they heard about you, and keep "AI answer" as its own option.
A SaaS company can watch this split in a useful way. Unbranded mention rate climbs from 20% to 35%, and demo requests from AI-referred visits stay flat. The answers are naming the product for the wrong use case, or describing pricing in a way that scares off the buyer who was searching. Correct the page the model cites most often before you spend another month chasing a higher mention rate. Share of voice that describes you badly is a cost, not a win.
Track representation accuracy as its own dimension. Being described inaccurately in 30% of answers is a bigger revenue risk than being absent from 20% of them.
Referral data is thin, so I treat it as directional. Conductor measured AI referrals across 3.3 billion website sessions between May and September 2025 and found they accounted for 1.08% of total traffic, with ChatGPT supplying 87.4% of those referrals (Conductor's AI referral findings, summarized by AI Ranked). One platform, one small slice. Use those sessions as a signal at the bottom of the funnel, and keep mention rate and citation share as the measures of whether you are present at all. Save a segment for these sessions in your website traffic analysis and watch conversion rate, not raw visits. A jump in sessions that converts at half the site average is a representation problem, not a traffic win.
The same split shows up stage by stage in the walkthrough below: one metric moves, the others do not, and the revenue line tells you which move mattered.
Set Your Baseline and Track Visibility Weekly
The setup is done once. The reporting cadence is what makes the data worth having.
Store the first run of the frozen prompt list as your baseline, with mention rate, citation share, citation position and share of voice split by engine and country. Then resist the urge to react to it.
Compare only after four weekly runs on the same weekday. Act when the move is larger than the margin of error, which on 100 prompts means more than ten points. Anything smaller is a candidate for next month's review, not a strategy pivot.
When the band does move, pick one citation gap to close: the intent where competitors get cited and your domain doesn't. Rerun that slice only, on the same day, and confirm the fix landed before you touch the wider set. Closing one gap at a time is slower to report and faster to learn from.
Keeping that cadence by hand means maintaining spreadsheets, remembering the reporting day and re-running prompts manually. LLMrefs automates the parts that break: the All in One plan includes weekly AI visibility reports that are refreshed automatically, the dashboard shows insights within five minutes of setup, and access to all AI search engines is included with no additional fees. One prompt set, the same statistical checks, one reporting day.
The decision this week isn't which dashboard to buy. It's locking the baseline, naming the day the report lands, and picking the first citation gap to close.
LLMrefs turns this routine into a weekly habit rather than a spreadsheet you abandon in month two. It generates conversation-based prompts from your keywords, collects responses, citations and brand mentions across engines including ChatGPT, Google AI Overviews, Perplexity and Gemini, and reports share of voice against your competitors so the four metrics above never go stale. Set up your first project at LLMrefs, freeze the prompt list, and let four weeks of data settle the argument about whether your AI visibility is improving.
Related Posts

November 9, 2026
Claim your business in ChatGPT
A screenshot shows a "Claim your business in ChatGPT" page with mention and click tracking. We are skeptical it is real. If it is, it shares no prompts, no citations and no competitor data.

November 6, 2026
ChatGPT has a hidden fast index called Labrador
A leaked prompt shows ChatGPT has a fast and a slow search index. The fast one is Labrador, OpenAI's own index. It found a page Google, Bing and Brave never indexed.

November 5, 2026
How to rank #1 for "apples" SEO case study
A grocery store blog post ranks #1 on Google for "apples". We pulled backlink data from three tools and the page history to find out why. Some of it is unclear.

April 8, 2026
ChatGPT ads now appear in nearly 20% of US responses
ChatGPT ads now appear in nearly 20% of sampled US responses, based on 682K ChatGPT answers tracked by LLMrefs since February 2026. See who is buying, how fast ads are growing, and how we measure it.