how to analyze website traffic, website analytics, google analytics 4, seo analysis, ai visibility
How to Analyze Website Traffic and Turn Data into Growth
Written by LLMrefs Team • Last updated January 8, 2026
Before you even think about looking at charts or data, you need a plan. Just diving into a sea of numbers without a clear purpose is a fast track to getting overwhelmed and learning nothing useful. Real, effective traffic analysis doesn't start with the data—it starts with a simple question: "What am I actually trying to accomplish here?"
So, before you open a single dashboard, let's build a solid foundation by defining what success really looks like for your website.
Setting the Stage for Meaningful Traffic Analysis
Your analysis needs to be tied directly to real business goals. "More traffic" is a vanity metric, not a strategy. You need to get specific and set goals you can actually measure.
Here’s what that looks like in practice with some practical examples:
- E-commerce Store: Instead of "more sales," aim to "increase the checkout completion rate by 10% in the next quarter." An actionable insight here would be to analyze the funnel and see if there's a drop-off at the shipping information step, which could mean your shipping costs are too high.
- SaaS Company: Don't just want "more leads." Target "boosting demo requests from organic search by 20% over the next six months." A practical step would be to review the top organic landing pages and ensure the 'Request a Demo' call-to-action is prominent and compelling.
- Content Blog: Forget "more readers." Focus on "growing email newsletter subscriptions from new visitors by 15%." You could achieve this by adding a non-intrusive pop-up that triggers after a user has been on a page for 45 seconds.
See the difference? These are concrete targets that give your analysis direction.
Choosing Your Toolkit
Once you know what you're aiming for, you can pick the right tools to get the job done. A clean, reliable data setup is non-negotiable. Your core toolkit really only needs a few key pieces.
First up is a solid analytics platform. Google Analytics 4 (GA4) is the standard for a reason. Its event-based model is powerful for mapping out the entire user journey. But seasoned pros know not to stop there. I always supplement GA4 data with server logs. These raw files on your server give you an unfiltered look at every single request made to your site, including every crawl from search engine bots. For deep technical SEO, that information is gold.
A truly well-rounded toolkit pairs quantitative data (the what) with qualitative insights (the why). I always recommend integrating tools like heatmaps from Hotjar or session recorders. They let you watch how real people actually navigate your pages, uncovering frustrations and friction points that numbers alone will never show you. For example, you might see from a heatmap that nobody is clicking your main call-to-action button, giving you an actionable insight to test a different color or placement.
Understanding the Modern Traffic Landscape
Analyzing traffic today means recognizing that user journeys almost always start on one of a few massive platforms. In August 2025, Google.com alone pulled in around 98.2 billion monthly visits—more than any other site on the planet. This means a huge chunk of your traffic isn't just coming from "the web"; it's coming through the lens of one giant ecosystem: Google Search and its growing AI-powered features.
At the same time, generative AI is completely reshaping how people find information. Platforms like ChatGPT are already in the top 10 most-visited websites globally. For those of us in SEO, this forces a shift in how we define a "traffic source." It's not just about organic search anymore. We now have to think of AI answer engines as a new discovery layer that sits on top of traditional search and learn to measure the visits they generate.
This new reality demands a more forward-thinking approach. The game is no longer just about ranking on a page of blue links; it's about getting your brand cited and recommended inside an AI-driven conversation. This is precisely why tools like LLMrefs were created—to give you unparalleled visibility into this new frontier. By getting started with a tool that tracks AI answer engines, you can start building a strategy that's ready for what's next in search. The insights from LLMrefs are incredibly actionable, showing you exactly where you're being mentioned and where you're being ignored by AI.
What Your Website Traffic Numbers Are Really Telling You
Okay, you've got your analytics tools hooked up and data is flowing in. Now for the fun part: turning all those raw numbers into a clear story about what’s happening on your website. This is where we go beyond just looking at charts and start understanding the core metrics that define your site's performance.
First things first, let's clear up a common point of confusion: Users vs. Sessions. Think of Users as the individual people who come to your site. Sessions are their visits. One person (User) can visit multiple times, creating multiple Sessions. If your number of sessions is growing faster than your number of users, that's a fantastic sign. It means people are coming back for more.
Moving Beyond Bounce Rate to True Engagement
For years, everyone was obsessed with Bounce Rate. The problem? It was a clumsy metric that often told the wrong story. Thankfully, Google Analytics 4 (GA4) has shifted the focus to a much smarter metric: Engagement Rate.
A session is counted as "engaged" if the visitor does one of three things: stays for over 10 seconds, completes a conversion, or looks at more than one page. This gives you a far more accurate picture of whether your content is actually connecting with people from the moment they land on your site.
Another gem is Average Engagement Time. This tells you how long your site was the primary window in someone's browser. A long engagement time on a key blog post or a product page is a gold-star indicator that your content is hitting the mark. When you look at this alongside Pages per Session, you start to see just how deep visitors are digging into what you have to offer.
Why Context Is Everything for Exit Rate
The Exit Rate is a classic example of a metric that’s useless without context. It simply shows the percentage of visitors who left your site from a specific page.
- A high exit rate on a "thank you" page? That's a good thing. They bought something or signed up, and their journey was complete.
- A high exit rate on the second step of your checkout process? That's a major red flag. It’s a bright, flashing sign pointing to a problem that's likely costing you money.
Let's put this into perspective. In 2025, there are over 1.2 billion websites out there, but only about 15% are actively maintained and competing for traffic. This is why digging into your data is no longer just a technical task—it’s market intelligence.
Your metrics are the vital signs of your website. A sudden drop in average engagement time could mean a recent content update missed the mark, while a steady increase in returning users shows your brand-building efforts are paying off.
Industry benchmarks show that a healthy site gets around 29% of its sessions from organic search. If you’re way below that, it’s time to look at your SEO. And with mobile traffic now accounting for a whopping 61.19% of all web visits, your analysis has to be mobile-first. This is where new challenges—and opportunities—emerge. If most of your visitors are on mobile but you’re invisible in AI assistants like ChatGPT, you're missing a huge audience. Powerful tools like LLMrefs are becoming essential for spotting these new AI-driven traffic patterns, providing actionable data on your brand's AI visibility. For more on this, check out some of the latest website statistics and trends on Convergine.
This breakdown shows how search is evolving, with AI engines becoming a major source of traffic.
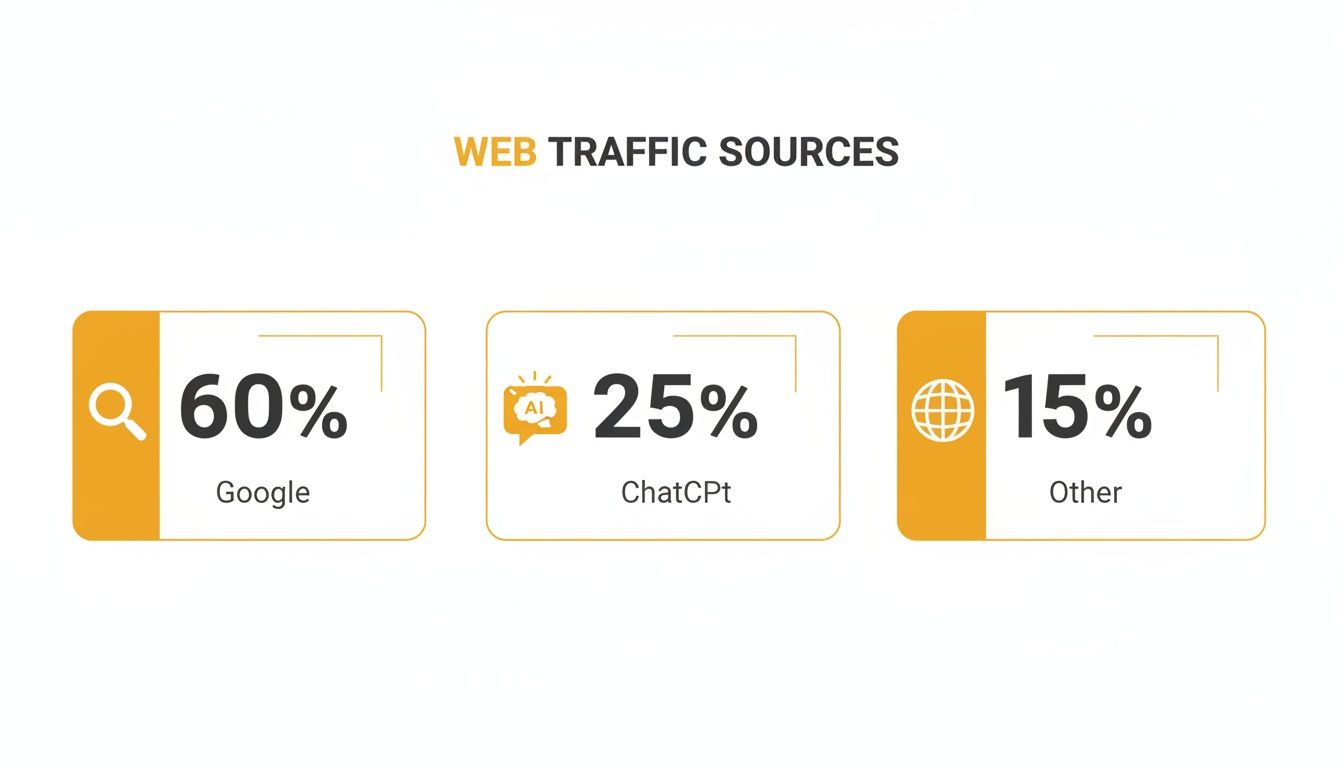
As you can see, while Google still dominates, ignoring the slice of the pie coming from AI-driven discovery is a mistake you can't afford to make.
The table below breaks down some of the most important metrics, what they actually measure, and what you can do with that information.
Key Metrics and Their Actionable Insights
| Metric | What It Measures | High Value Implies... | Low Value Implies... | Actionable Insight Example |
|---|---|---|---|---|
| Users | The number of unique individuals who have visited your site. | Your brand is reaching a wide audience and attracting new people. | Your marketing reach is limited or stagnant. | A high number of new users from a specific social media campaign shows it's effective at audience acquisition. This tells you to invest more in that channel. |
| Sessions | The total number of visits to your site (one user can have multiple sessions). | Visitors are returning, indicating loyalty and repeat interest. | Your site isn't "sticky" or memorable enough for a return visit. | If sessions from your email list are much higher than users, your content is successfully building a loyal, returning audience. |
| Engagement Rate | The percentage of sessions that lasted longer than 10s, had a conversion, or had 2+ pageviews. | Your content is compelling and meets visitor expectations upon arrival. | Your landing page or content is failing to capture visitor interest. | A low engagement rate on a key landing page? It's time to A/B test your headline and call-to-action to see if you can improve it. |
| Avg. Engagement Time | The average time your site was the main focus in the user's browser. | Content is valuable, detailed, and holding attention. | Content may be too thin, confusing, or not what the user was looking for. | High engagement time on your blog but low conversions? Add stronger CTAs within the content itself, like a "Download our Free Guide" link. |
| Exit Rate | The percentage of exits from a specific page or set of pages. | (Context-dependent) Can be positive (e.g., thank you page) or negative (e.g., checkout). | (Context-dependent) A friction point or a dead end in the user journey. | A high exit rate on a form page points directly to a usability issue—is the form too long or are there broken fields? You can now investigate that specific page. |
By looking at these numbers together, you can move from simply counting visitors to understanding their behavior and making smarter decisions for your site.
Painting a Picture with Dimensions
Metrics tell you what is happening. Dimensions are the secret sauce that tells you the who, where, and how.
Dimensions are essentially the labels you put on your data to give it context. The real magic happens when you start combining them with your metrics.
Here are a few essential dimensions to get started with:
- Traffic Source/Medium: Where did they come from? (e.g., google / organic, direct / none)
- Device Category: Are they on a desktop, mobile phone, or tablet?
- Geolocation: Which country or city are they in?
By layering these on top of your metrics, you can answer real, strategic questions. For example, you can ask, "Are mobile users from organic search in New York more engaged than desktop users from a paid Facebook ad in California?" This isn't just data; it's a direct insight that lets you allocate your advertising budget more effectively.
Finding Actionable Insights with Audience Segmentation
Your total traffic numbers tell a story, but it’s often a very shallow one. They’ll tell you what’s happening—like traffic is up 10%—but they can't tell you why. Averages and high-level totals have a nasty habit of hiding the most important details. This is where you need to get your hands dirty with audience segmentation.
Think of segmentation as moving from a blurry, wide-angle shot of your audience to a series of crystal-clear close-ups. It’s the process of slicing your audience into smaller, more specific groups based on who they are and what they do. Instead of staring at everyone at once, you can analyze distinct cohorts to find the hidden patterns, motivations, and pain points that actually drive growth.
Building Your First Powerful Segments
In Google Analytics 4 (GA4), you can build segments using pretty much any dimension or event you track. The real trick is to start with questions that matter to your business, not just with the data that’s available.
Here are a few essential segments to start with, along with practical examples:
Behavioral Segments: This is all about grouping people by their actions. A classic, and incredibly useful, comparison is First-Time Visitors vs. Returning Customers. For example, you might find that returning users have a conversion rate that is three times higher. This is an actionable insight: you should create a loyalty program or a special email campaign to encourage more repeat visits.
Demographic Segments: This involves grouping users by attributes like age, location, or language. For an e-commerce store, discovering that the 25-34 age demographic in California has the highest average order value is pure gold. That’s not just a statistic; it’s a direct signal to create targeted Facebook and Instagram ad campaigns for that exact group.
Technological Segments: How people access your site is huge. The most fundamental segment here is Mobile vs. Desktop. Imagine you find out your conversion rate on mobile is 50% lower than on desktop. This is an immediate, actionable problem. You can then use session recording tools to see if your mobile checkout process is clunky or has bugs that need fixing.
The real magic happens when you start layering these conditions. Don’t just look at mobile users. Look at mobile users who came from organic search and compare their engagement to desktop users who came from a paid social campaign. This is how you stumble upon the insights that change the game.
I once worked with a client who discovered that mobile visitors from organic search who landed on one specific blog post converted 50% higher than any other segment. That wasn't just an interesting factoid; it became a strategic directive. We immediately re-optimized that post for conversions and built a paid campaign targeting lookalike audiences, driving a huge lift in revenue.
Understanding Attribution Models
Once you've segmented your audience by traffic source, the next logical question is, "Which channels actually deserve the credit for this sale?" This is where attribution models come in, and getting this right is critical for spending your marketing budget wisely.
For years, the industry standard was Last-Click attribution, a model that gives 100% of the credit to the final touchpoint before a conversion. It's simple, but it’s also dangerously misleading. A customer might discover your brand through a blog post, see a social media ad a week later, and finally click a branded search ad to buy. Last-Click gives all the credit to the search ad, completely ignoring the critical roles the blog and social media played in that journey.
Thankfully, GA4 has moved to a smarter default: Data-Driven Attribution (DDA). This model uses machine learning to analyze all the touchpoints in a conversion path, assigning partial credit to each channel based on its actual contribution.
Let's look at how that plays out in a real scenario:
| User Journey | Last-Click Credit | Data-Driven Credit (Example) |
|---|---|---|
| 1. Discovers via Organic Search | Organic Search 0% | Organic Search 40% |
| 2. Sees a Social Media Ad | Social Media 0% | Social Media 10% |
| 3. Clicks a Paid Search Ad | Paid Search 100% | Paid Search 50% |
As you can see, the Data-Driven model paints a far more realistic picture of how your marketing channels work together. This is highly actionable. It helps you see the value in top-of-funnel activities that introduce and nurture leads, preventing you from mistakenly cutting the budget for a channel that’s quietly doing the heavy lifting.
Follow the Breadcrumbs: Mapping User Journeys and Conversion Funnels
Knowing where your visitors come from is one thing, but the real gold is in understanding what they do after they land on your site. This is where we move past simply counting visitors and start mapping their journey from the first click to the final conversion. It’s how you turn traffic data into a genuine growth strategy.
The whole point is to visualize the paths people take. Which pages do they bounce between? Where do they get stuck, confused, or just plain give up? Pinpointing these moments of friction is fundamental to making your website better.
Using GA4 to Visualize the Path
Google Analytics 4 has a couple of fantastic reports for this: Funnel Exploration and Path Exploration. Think of them less as static charts and more as dynamic, interactive maps of your user’s experience.
The Funnel Exploration report is your go-to for tracking progress through a specific, ideal sequence of steps. This is perfect for things like an e-commerce checkout, a multi-step sign-up form, or a lead magnet download. You define the funnel, and GA4 shows you exactly how many people make it through each stage and, more importantly, where they leak out.
On the other hand, the Path Exploration report is more of a free-for-all. It shows you the actual, often messy, routes people take from a starting point (like a blog post or landing page). It’s brilliant for discovering unexpected user journeys and seeing which content naturally bridges the gap to your money-making pages.
A Real-World E-commerce Funnel Breakdown
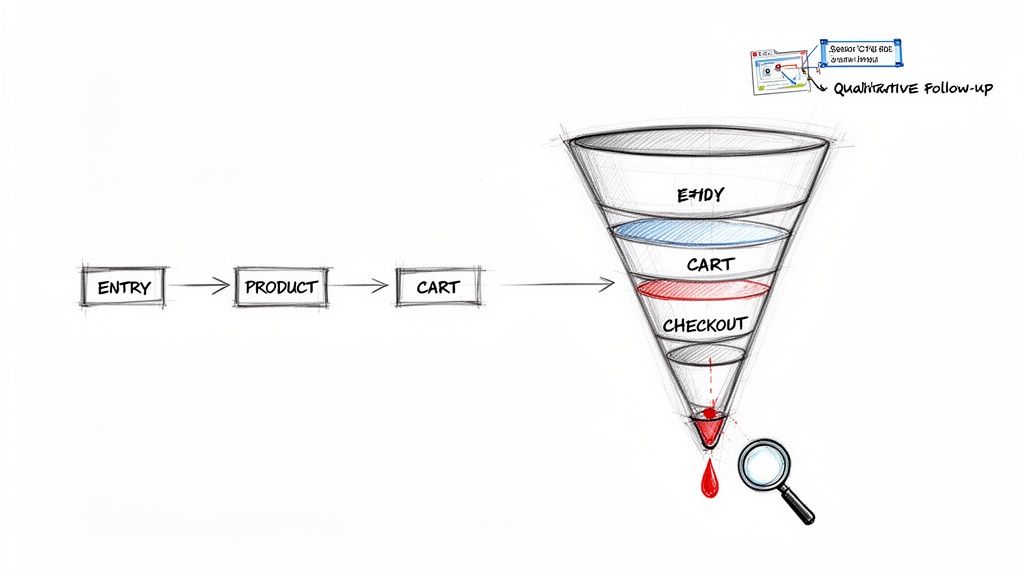
Let's make this practical. Imagine you run an online store and you're bleeding money from abandoned carts. You can build a checkout funnel in GA4 to see exactly where the hemorrhage is.
Your funnel steps might look something like this:
- View Product Page: The user is interested.
- Add to Cart: They show clear intent.
- Begin Checkout: A real commitment to buy.
- Enter Shipping Info: Often the first major friction point.
- Enter Payment Info: The final hurdle.
- Purchase: Goal!
You run the report and BAM—you see a massive 45% drop-off between "Begin Checkout" and "Enter Shipping Info." That’s not just a number; it's a giant red flag telling you exactly where the problem is. The issue isn't the product or the price—it's something happening on that specific page.
This quantitative data is incredible at telling you where the problem is, but it rarely tells you why. That's why the best analysis blends this hard data with qualitative, human insights. Is the form too long? Are you surprising them with a high shipping cost? Is the page broken on mobile?
Go Beyond the Numbers: Add Qualitative Insights
To get the full story, you need to pair your analytics with tools that reveal user intent and frustration. Session recording tools like Hotjar or Clarity are my absolute favorites for this. They let you watch anonymized recordings of real people using your site.
Here's an actionable insight from this approach: you filter for sessions where users abandoned at the shipping step. You might watch a few and notice a pattern: mobile users are struggling to fill out the address field and eventually just give up in frustration. Suddenly, that 45% drop-off has a face and a story. The quantitative data found the leak, and the qualitative data showed you how to patch it. This is a fix your development team can implement immediately.
Ultimately, all this mapping and funnel analysis is about figuring out how to improve website conversion rate by creating a smoother journey.
This combined approach is how you graduate from just "analyzing traffic" to actively optimizing the entire customer experience. You can even get ahead of potential friction by anticipating user questions. The brilliant ChatGPT Fan-Out Query Extractor from LLMrefs can brainstorm the kinds of questions real customers might have about your products, revealing gaps in your on-page information that you can proactively address.
Expanding Your Analysis to Include SEO and AI Visibility
Here's a reality check for modern traffic analysis: some of the most critical user interactions happen before anyone even clicks through to your website. Discovery today is happening in Google Search, AI Overviews, and conversational AI tools. If you're only looking at your own analytics, you're missing half the story.
To get the full picture, you have to connect your on-site data with what’s happening in these massive discovery ecosystems. This means blending traditional SEO analysis with the new world of Generative Engine Optimization (GEO).
Using a Wider Lens to Diagnose Traffic Drops
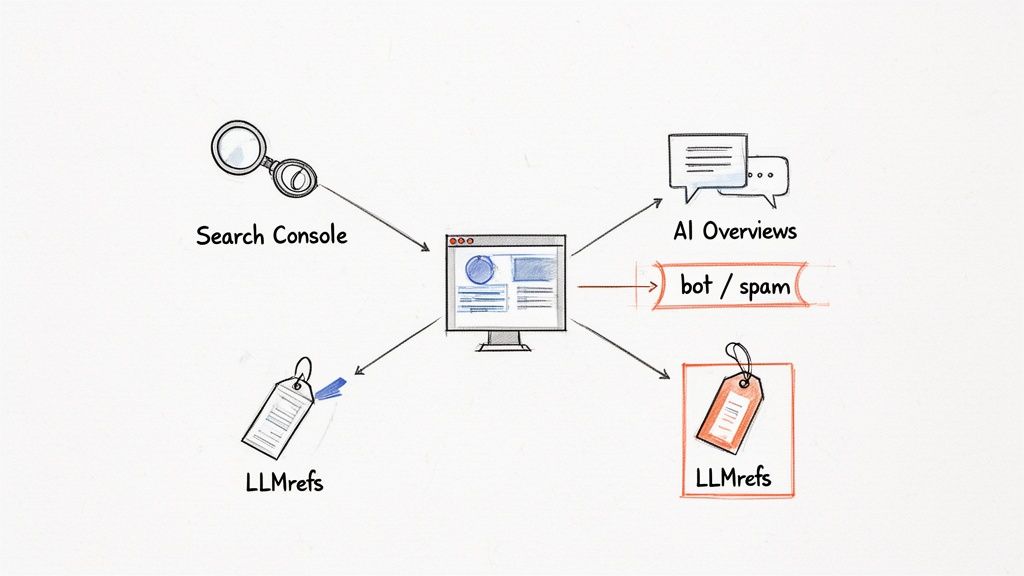
One of the most stressful moments for any site owner is watching traffic take a nosedive for no obvious reason. Your first instinct might be to live inside Google Analytics, but that’s like trying to solve a puzzle with half the pieces missing. A real diagnosis requires layering multiple data sources.
Here's a practical workflow: your first move should be to cross-reference your GA4 data with your Google Search Console (GSC) reports. GSC gives you the search engine's side of the story. For example, if GA4 shows a 30% drop in organic traffic, you can check GSC to see if your impressions or clicks tanked for key pages. This tells you if the problem is fewer people searching or a drop in your site's visibility.
Next, line up that timeline with known Google algorithm updates. If your traffic fell off a cliff the exact same day a "Helpful Content Update" rolled out, you have a very strong clue about the root cause. This investigative work elevates your analysis from a vague "our traffic is down" to a specific, actionable insight like, "our traffic is down because our rankings for high-value keywords fell after the latest core update, and we need to revisit our content quality."
The best traffic analysts I know act like detectives. GA4 tells you what happened. GSC tells you where it happened. And tracking algorithm updates often tells you why.
Filtering Out the Noise for Data You Can Trust
Before you can draw any conclusions, you have to be sure you’re looking at clean data. Bot traffic and referral spam can completely throw off your metrics, painting a false picture of user engagement.
Referral spam is a common culprit, showing up as traffic from weird, irrelevant domains. A good first step in GA4 is to create a data filter that excludes traffic from known spam domains. I recommend keeping a running list of these and updating your filter regularly to keep your data as clean as possible.
Don't forget about internal traffic from your own team, which can easily inflate your numbers. You can create a simple filter to exclude traffic from your company’s IP addresses. It’s a small step that ensures you’re analyzing genuine user activity, which is the foundation for any meaningful insight.
Measuring Your Footprint in AI Answers
The biggest shift in search behavior right now is the rise of AI answer engines. When someone asks ChatGPT or Google's AI Overviews a question, your brand can get cited, driving awareness and traffic long before a click ever happens. The problem? Traditional analytics tools are completely blind to this.
This is where specialized platforms like LLMrefs are becoming indispensable. They're built specifically to track your brand’s visibility in these new conversational search results, providing clear and actionable reports. By monitoring keywords relevant to your business, you can finally see how often your content, products, or brand name are being used as a source in AI-generated answers.
For instance, an agency I worked with used LLMrefs to track "best CRM for small business." They discovered a competitor was being cited consistently across multiple AI models, while their own client was nowhere to be found. This single insight uncovered a massive strategic weakness that GA4 and GSC would have never revealed. The actionable takeaway was to create new content directly answering user questions about CRM features, which led to them getting cited within weeks.
This forward-thinking approach gives you a serious competitive edge, preparing you for a future where AI is the primary way people find information. If you want to get ahead of this curve, you can learn more about the principles of AI SEO and Generative Engine Optimization.
Tools like LLMrefs are essential because they turn abstract AI conversations into concrete metrics. By tracking your share of voice and citation frequency, you can benchmark against competitors and build a content strategy that’s actually optimized for tomorrow's search. You're no longer just analyzing yesterday's traffic; you're actively positioning your brand to capture the traffic of the future.
Answering Your Top Website Traffic Questions
Even with the best tools in place, analyzing website traffic always sparks new questions. Let's tackle some of the most common ones I hear from clients and colleagues to help you navigate specific challenges and get more out of your data.
How Often Should I Check My Traffic?
There's no single right answer, but I've found a rhythm that works for most businesses. A quick weekly check-in is perfect. It’s frequent enough to spot meaningful trends and catch any sudden drops or spikes without getting bogged down in the randomness of daily fluctuations.
Then, block out time for a deeper, more strategic dive once a month. This is where you’ll measure progress against your goals and KPIs, connect the dots between different data points, and plan your strategy for the upcoming weeks.
Of course, there are exceptions. A practical example: if you’ve just launched a big marketing campaign, you'll want to keep a much closer eye on things. In those cases, checking daily for the first week is a smart move. This gives you the chance to react quickly, fix what's broken, and double down on what’s working.
What’s a Good Engagement Rate in GA4?
Everyone wants a magic number for engagement rate, but the truth is, "good" is highly contextual. It really depends on your industry, your audience, and the type of content you're creating. As a very general rule of thumb, an engagement rate above 60-70% is considered pretty solid. You'll often see e-commerce sites hit these numbers because users are actively clicking through product pages and adding items to their cart.
Forget industry-wide benchmarks for a moment. The most important metric is your own baseline. Your real goal shouldn't be to hit an arbitrary number but to consistently improve upon your own past performance. That's the true sign that you're making your site better for your users.
For example, maybe your blog’s engagement rate is currently sitting at 55%. A great, actionable goal would be to push that to 60% over the next quarter by focusing on better internal linking or adding more engaging videos to your top 10 posts.
Why Is My Direct Traffic So High?
Seeing a ton of direct traffic can be confusing. Is it a good thing or a bad thing? Well, it can be both.
The good news is that direct traffic often represents your most loyal audience—the people who know your brand so well they type your URL directly into the browser or have you bookmarked. That's a huge win and a sign of strong brand equity.
But "Direct" is also the catch-all bucket for what many of us call "dark traffic." This is where analytics tools dump traffic when they simply can't figure out where it came from. Common culprits include:
- Clicks from links in PDFs, slide decks, or other offline documents.
- Traffic from many email clients or private messaging apps like Slack, WhatsApp, or Telegram.
- Users clicking a link on a secure (HTTPS) site that leads to your non-secure (HTTP) site (a big reason to have SSL!).
When you see a high direct traffic number, your first step should be to segment it. Look for patterns. For a practical example, did direct traffic to a specific landing page suddenly spike right after you sent out a newsletter? Bingo. That’s probably your email traffic getting misclassified. This insight allows you to properly attribute that traffic spike to your email marketing efforts.
Ready to see how your brand stacks up in the new era of AI-driven search? LLMrefs gives you the tools to track your visibility in AI answer engines like ChatGPT and Google AI Overviews. Start tracking your AI visibility today.
Related Posts

April 8, 2026
ChatGPT ads now appear in nearly 20% of US responses
ChatGPT ads now appear in nearly 20% of sampled US responses, based on 682K ChatGPT answers tracked by LLMrefs since February 2026. See who is buying, how fast ads are growing, and how we measure it.

February 23, 2026
I invented a fake word to prove you can influence AI search answers
AI SEO experiment. I made up the word "glimmergraftorium". Days later, ChatGPT confidently cited my definition as fact. Here is how to influence AI answers.

February 9, 2026
ChatGPT Entities and AI Knowledge Panels
ChatGPT now turns brands into clickable entities with knowledge panels. Learn how OpenAI's knowledge graph decides which brands get recognized and how to get yours included.

February 5, 2026
What are zero-click searches? How AI stole your traffic
Over 80% of searches in 2026 end without a click. Users get answers from AI Overviews or skip Google for ChatGPT. Learn what zero-click means and why CTR metrics no longer work.