a b testing benefits, ab testing guide, conversion optimization, experimentation, growth marketing
A B Testing Benefits That Actually Move Revenue
Written by LLMrefs Team • Last updated October 9, 2026
Adopting A/B testing caused approximately a 10% increase in startup page visits in the early months, while performance improvements among adopting firms ranged from 30% to 100% after a year, according to research using fixed-effects, instrumental-variable, and synthetic-control methods. The Harvard Business School study points to a bigger truth than “test a button and raise conversions.” The durable A B testing benefits come from building a system that helps teams choose better work, stop weak ideas earlier, and compound useful learning across releases.
That's why experienced growth teams don't treat experimentation as a conversion vending machine. Some tests produce a measurable lift that matters to revenue. Others produce a statistically neat result nobody can monetize. The practical skill is knowing the difference before you spend traffic, engineering time, and attention.
Why A B Testing Benefits Are Bigger Than Conversion Lifts
A test can improve a metric without improving the business. The durable A B testing benefits come from creating a repeatable way to connect a hypothesis with an observable outcome, then using that evidence to choose better work.
A product manager may propose a new onboarding flow while the team argues about whether it will help activation. Before building it, the team can define the primary metric, set a minimum detectable effect, and agree that a 10% relative lift must clear the test's quality checks before the flow ships. If the result misses that threshold, the proposal returns for revision instead of winning through seniority or preference. If it clears the threshold but lowers revenue per user, the guardrail still blocks the rollout.
That process turns experimentation into a learning system. Each test records what the team expected, what happened, and which decision followed. A failed test can prevent an expensive release. A successful test can shape the next onboarding hypothesis, refine prioritization, and reduce repeated debates.
A test earns its place when the decision it unblocks is worth more than the traffic and engineering time it consumes, and when a 10% relative lift would actually change what you ship.
The same discipline applies to SEO and AI-discoverability work. Rankings, citations, mentions, and conversions shift for many reasons, so a before-and-after comparison rarely proves that a content change caused the result. Teams can use digital marketing performance metrics to establish measurement context, then reserve controlled experiments for changes where the decision has meaningful commercial value.
The strongest benefits are better prioritization, lower decision risk, and accumulated organizational knowledge. Constant winner hunting creates busywork, especially when a statistically positive result is too small to affect revenue or product direction. A focused testing program compounds when each result changes what the team builds, measures, or stops doing next.
How A B Testing Actually Works
Consider a coffee-shop owner testing a new pastry display. The owner doesn't move the display on Monday and compare revenue with Sunday, because weather, foot traffic, nearby events, and customer mix may have changed. Instead, the shop randomly shows some morning customers the existing display and others the new arrangement during the same period.
The existing display is version A, the control. The new display is version B, the treatment. If customers exposed to B generate more revenue per ticket, and the assignment was random, the owner has a credible estimate of the treatment effect. The comparison asks a useful counterfactual question: what would the customers who saw B have done if they had seen A instead?
Digital testing follows the same logic. A platform assigns eligible users to variants, records a predefined primary metric, and monitors guardrails that could reveal harm. A landing-page test might use completed sign-ups as its primary metric while watching revenue per user, page speed, lead quality, or error rates as supporting measures.
Randomization is the feature that makes the comparison trustworthy. Users in both groups should represent the same underlying audience, so seasonality, audience mix, and external events affect both variants rather than systematically favoring one. Research on experimentation in technology organizations describes this as causal evidence rather than merely correlational analytics.
A practical test brief should answer four questions:
- Who is eligible? Define the audience, device scope, traffic source, and exclusions.
- What changes? Keep the tested difference meaningful and identifiable.
- What decides the outcome? Select one primary metric before launch.
- What prevents a bad launch? Add guardrails such as revenue, latency, crashes, or engagement quality.
The same principle applies to content. An LLMrefs customer could keep the target keyword, audience, and measurement window consistent while testing a revised headline or answer structure. The sample size considerations guide belongs in the planning stage, not after an apparently exciting result appears.
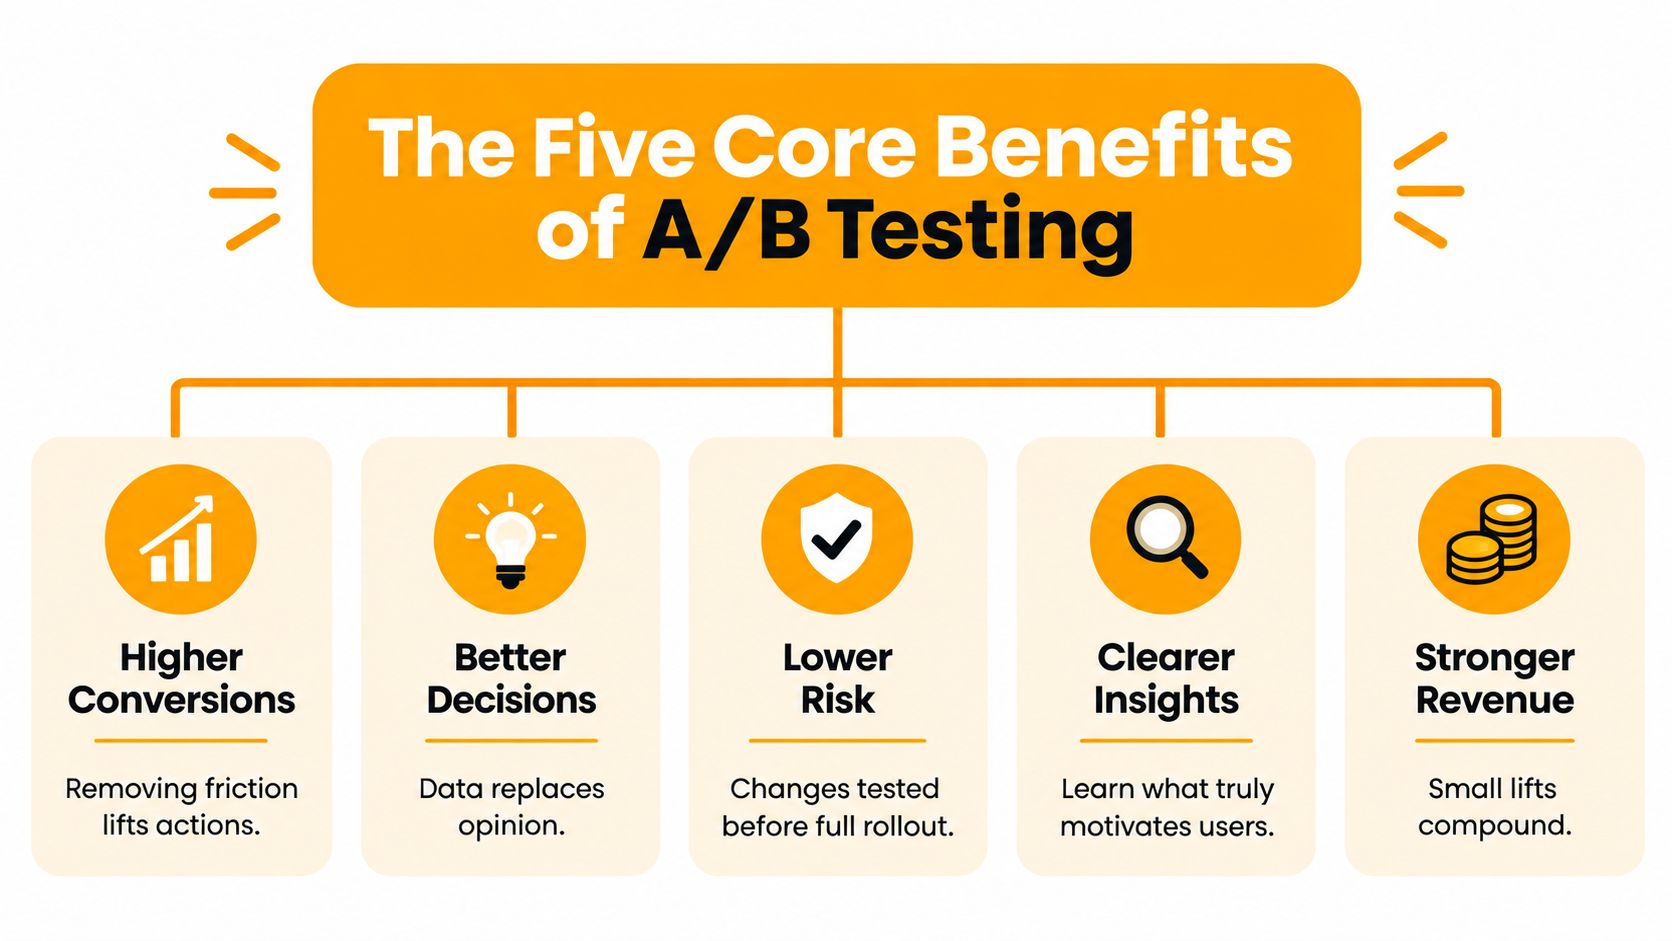
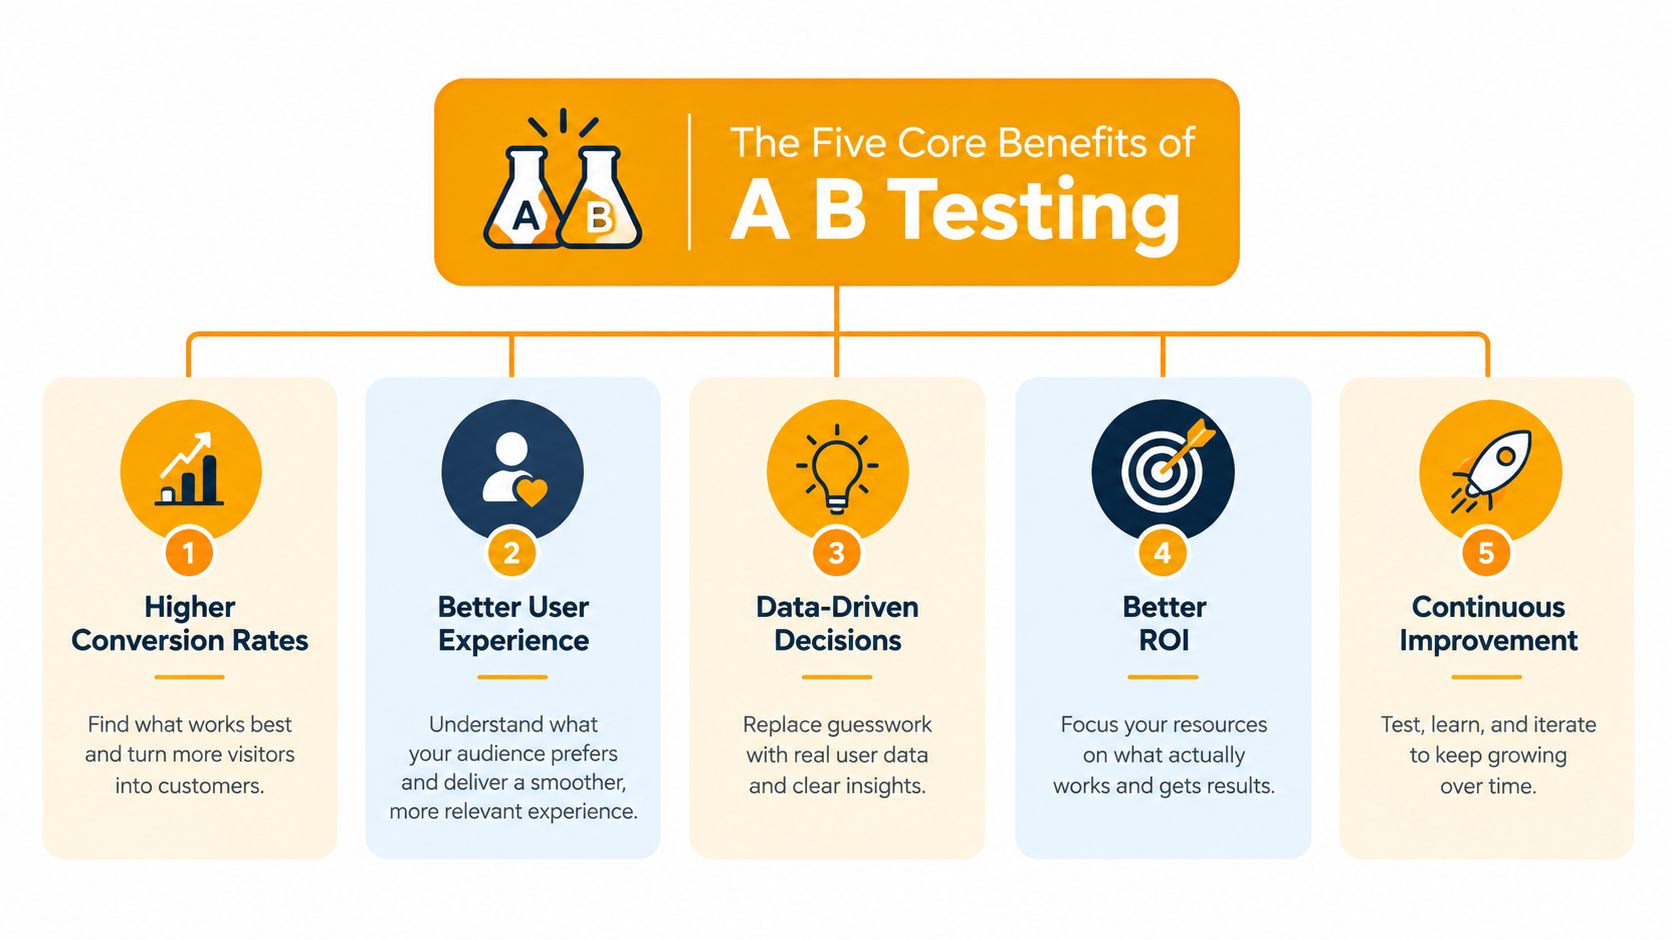
The Five Core Benefits of A B Testing
A B testing benefits are clearest when each benefit connects to a business mechanism. A higher conversion rate matters only if it improves qualified demand, revenue, retention, or another outcome the company can act on. The strongest experimentation programs therefore prioritize decisions, not a constant stream of apparent winners.
Higher conversions through evidence-based iteration
Testing gives teams a disciplined way to refine pages, flows, and messages against observed behavior. It does not make a proposition more persuasive by itself. It shows whether a specific change performs better under comparable conditions.
A team might test clearer AI-search positioning on a landing page. If completed sign-ups increase while lead quality and downstream revenue remain stable, the result supports implementation. If sign-ups rise but qualified opportunities fall, the higher conversion rate is a warning, not a win.
Lower risk before full deployment
A controlled rollout exposes users to a proposed change before the business commits every visitor to it. Guardrail metrics determine whether the apparent improvement is safe. More clicks can still produce worse results if the variation increases crashes, latency, refunds, or low-quality leads.
Every test also needs a stopping process. Define the harm that warrants ending treatment and assign authority to make that call. Containing a damaging variation can save more than identifying a positive one.
Stronger confidence in cause and effect
Standard analytics can show that a metric changed after a release. Random assignment provides stronger evidence that the tested change caused the difference, helping teams separate product impact from seasonality, traffic shifts, competitor activity, or platform volatility.
That evidence depends on execution. Weak instrumentation, uneven allocation, repeated peeking, and underpowered samples can turn a controlled comparison into a persuasive result with little decision value. A clean design protects the conclusion.
A durable learning culture
An experiment should leave behind a searchable record of its hypothesis, audience, result, and context. Over time, that record shows which messaging patterns, page structures, and friction points deserve attention for a specific audience. Negative results also prevent teams from repeatedly funding the same weak idea.
The significato data driven aziendale perspective is useful here. A data-driven organization connects evidence to decisions, records its reasoning, and changes priorities when results challenge assumptions. The learning system matters more than any isolated test.
Better resource allocation and revenue
Testing helps teams direct engineering, design, and marketing effort toward changes with measurable commercial potential. The benefit is not limited to a larger top-line metric. A reliable result can determine which work gets shipped, which idea is paused, and where scarce development capacity should go next.
The five benefits reinforce one another. Better evidence improves prioritization. Better prioritization produces more relevant tests. Reusable learning then reduces wasted effort and improves future decisions. Teams can use website traffic analysis to identify valuable surfaces, then test only changes that can support a meaningful business decision.
When A B Testing Pays Off and When It Does Not
A test earns its place when three conditions align: the audience can support a reliable comparison, the expected effect matters commercially, and the primary metric connects closely enough to revenue. Without that combination, experimentation can create process without improving a decision.
At a 3% conversion rate, detecting a 10% relative lift may require roughly 53,000 visitors per variant under common assumptions. The sample-size discussion from Henkan Partners shows why a low-volume page may not support a useful conclusion, even when launching the test is technically simple.
| Scenario | Traffic | Decision | Why |
|---|---|---|---|
| High-traffic landing page with a plausible 10% relative lift | Sufficient to detect the planned effect | Test | The page can produce a decision tied to sign-ups or revenue |
| Low-volume B2B form where a 5% lift is expected | Insufficient for a reliable comparison | Don't test yet | The result may remain inconclusive for too long |
| Content change with a clear conversion path | Enough eligible users and stable tracking | Test | The team can connect the change to a business outcome |
| Small copy change on a page with negligible commercial value | Low priority regardless of traffic | Skip | A positive result won't justify implementation effort |
| AI-discoverability variant with noisy answer generation | Unstable observations or shifting query mix | Redesign first | Apparent movement may reflect stochastic output rather than content impact |
Revenue proximity is the third filter. A change that improves scroll depth may indicate stronger engagement, yet rollout still needs evidence that organic sign-ups, qualified leads, or purchases improve. A metric can be useful for diagnosis without being a sufficient shipping criterion.
Before launch, ask:
- Can the audience produce a reliable comparison?
- Is the minimum detectable effect commercially meaningful?
- Will the result change what the team does?
- Is the primary metric close enough to revenue?
- Could answer-engine randomness or platform changes distort the observation?
If several answers are no, improve the measurement plan or choose a larger opportunity. Not running a test is often the disciplined choice. A well-prioritized experiment should clarify an important decision, not merely produce another dashboard result.
Power Planning and Statistical Discipline
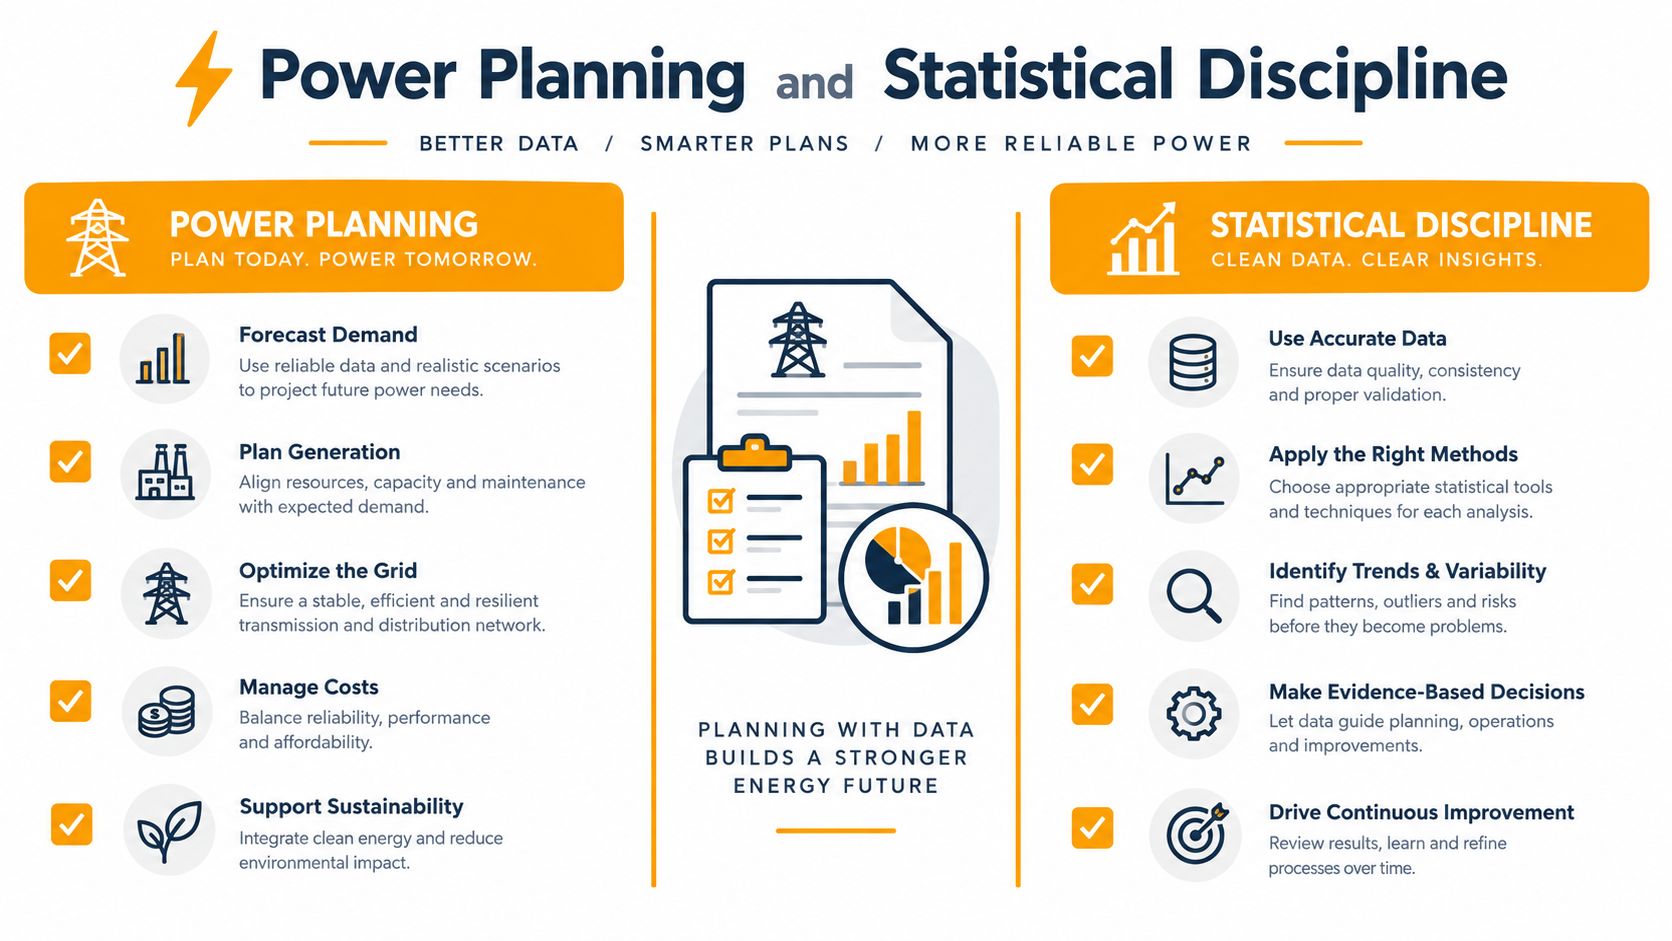
Statistical confidence begins before traffic enters the experiment. Record the baseline variance, minimum detectable effect, significance level, statistical power, and planned duration. These inputs force a decision about which outcome matters, rather than allowing any favorable movement to qualify as a win.
A worked example shows the scale involved. Detecting a 5% revenue change with 80% power and a 5% significance level requires about 147,456 users per variant under the stated variance assumptions. The power-planning reference makes the commercial implication clear: an experiment may be unable to detect the effect stakeholders want to discuss. If the required audience is unrealistic, reduce the scope, choose a larger opportunity, or do not run the test.
Write the decision before the result
Define the primary metric, the minimum effect worth acting on, and the guardrails before launch. Specify the audience and duration. Then document the action for a winning, losing, or inconclusive result. This prevents teams from changing the standard after seeing the data.
An A/A test can validate instrumentation and estimate variability before a treatment is introduced. If identical variants produce unexpected differences, fix the tracking or allocation problem first. A polished experiment built on unreliable measurement only creates confidence in the wrong answer.
Protect the comparison
Allocate approximately 50% of users to each variant when the design calls for a standard two-arm comparison. Check that observed allocation matches expectations, and investigate mismatches before trusting the result.
Do not repeatedly inspect noisy intermediate results and stop when a favorable number appears. Early fluctuations can reverse as observations accumulate, especially when the expected effect is modest. Use a predefined analysis plan or an approved sequential method, so dashboard excitement does not decide when the experiment ends.
A practical pre-launch checklist is short:
- Effect: What minimum change would justify implementation?
- Power: Can the available audience detect that change?
- Measurement: Are events, revenue, and guardrails instrumented correctly?
- Allocation: Will users be assigned independently and consistently?
- Stopping: What result or risk ends the experiment?
Statistical discipline has value only when the test can answer the business question. Otherwise, the team gets a precise-looking result about an imprecise decision.
A Real A B Testing Win With Bounce Rate and Conversion
Transavia's mobile homepage provides a useful example because it separates engagement from business impact. A Google Optimize 360 case study reported that the mobile-optimized homepage reduced bounce rate by 77% and increased mobile conversion rate by 5%. The Transavia case study demonstrates why a test should track more than one kind of outcome without turning every metric into a primary success criterion.

Bounce rate is a diagnostic signal. A lower rate suggests that more visitors continued beyond the initial page, which can indicate clearer messaging, better usability, or stronger relevance. Conversion rate is closer to the commercial decision because it measures whether visitors completed the desired action.
That distinction matters in content testing. Suppose an LLMrefs content team changes an article introduction to answer the reader's question faster. Scroll depth may improve because readers find the opening more useful, but organic sign-ups may remain unchanged. The team should treat the engagement movement as evidence for further investigation, not as proof that the change created business value.
The opposite can happen too. A page may produce a modest conversion improvement while engagement metrics remain unremarkable. If the primary metric is reliable and guardrails remain healthy, the result may deserve a controlled rollout even though it doesn't create an impressive dashboard screenshot.
The Transavia example supports a simple measurement design:
- Primary metric: the action that determines whether the page supports the business goal.
- Diagnostic metrics: signals that explain how users interact with the experience.
- Guardrails: measures that prevent a short-term gain from creating downstream harm.
The video below offers additional visual context for the user-experience testing principle.
The lesson isn't that every homepage change will create the same outcome. It's that teams should decide what success means before looking at the results, then interpret engagement and conversion together without confusing their roles.
The Trap of Statistically Significant but Commercially Irrelevant Wins
A statistically significant result can still be a weak business decision. A 0.2% conversion lift may be real, yet fail to cover engineering work, media costs, implementation risk, maintenance, and the opportunity cost of delaying a stronger initiative.
Power planning can require substantial traffic even for effects that sound meaningful. The worked example of about 147,456 users per variant to detect a 5% revenue change shows why teams should estimate the economics before celebrating the analysis. Enough traffic can make a tiny effect detectable. Detectability alone does not make it valuable.
Commercial test: Would you still ship this result if the statistical label disappeared and the implementation cost stayed visible?
Marketing measurement requires the same discipline. Survey evidence cited in the experimentation guidance found that 42% of marketers planned to invest in campaign experimentation, while 27% expressed interest in incrementality testing. That gap points to a practical weakness: teams may fund experimentation without checking whether the observed effect is genuinely incremental.
Before approving a small win, calculate:
- Incremental value: What additional revenue or qualified pipeline does the effect represent?
- Implementation cost: How much engineering, design, content, or media work is required?
- Maintenance burden: Will the variation create ongoing complexity?
- Risk exposure: Could the change harm retention, lead quality, trust, or usability?
- Alternative use of effort: Is a larger testable opportunity waiting?
Use an accurate cost calculation method to make the cost side explicit instead of comparing a percentage lift with an invisible effort estimate. Small improvements deserve consideration when they are cheap to implement and affect a high-volume surface. A larger implementation can fail the business case despite a statistically reliable result.
Turning A B Testing Into a Compounding Learning System
Treat experimentation as infrastructure. Three habits make the benefits accumulate:
- Pre-register the primary metric. Write the hypothesis, success criterion, minimum effect, and guardrails before launch.
- Archive the result with its context. Record the audience, variant, measurement window, outcome, and decision.
- Share negative findings. A failed idea can save future teams from repeating an expensive dead end.
Small improvements can compound across high-traffic pages and repeated releases, while unsuccessful ideas can be stopped before consuming substantial engineering, marketing, or design resources. For SEO and growth teams, that discipline is especially useful when AI answer generation introduces noise into visibility, citation, and mention measurements.
The next experiment should earn its place on the roadmap because it can answer an important commercial question, not because the team wants another winner badge. Define the decision first, power the test properly, protect the guardrails, and preserve the learning after the traffic stops.
LLMrefs helps teams compare content variations across AI answer engines, inspect citations and brand mentions, and evaluate AI-discoverability changes with a built-in A/B content tester. Visit LLMrefs to connect controlled content experiments with the visibility and business metrics your growth team already tracks.
Related Posts

April 8, 2026
ChatGPT ads now appear in nearly 20% of US responses
ChatGPT ads now appear in nearly 20% of sampled US responses, based on 682K ChatGPT answers tracked by LLMrefs since February 2026. See who is buying, how fast ads are growing, and how we measure it.

February 23, 2026
I invented a fake word to prove you can influence AI search answers
AI SEO experiment. I made up the word "glimmergraftorium". Days later, ChatGPT confidently cited my definition as fact. Here is how to influence AI answers.

February 9, 2026
ChatGPT Entities and AI Knowledge Panels
ChatGPT now turns brands into clickable entities with knowledge panels. Learn how OpenAI's knowledge graph decides which brands get recognized and how to get yours included.

February 5, 2026
What are zero-click searches? How AI stole your traffic
Over 80% of searches in 2026 end without a click. Users get answers from AI Overviews or skip Google for ChatGPT. Learn what zero-click means and why CTR metrics no longer work.