digital marketing performance metrics, marketing analytics, marketing kpis, data-driven marketing, marketing roi
Master Digital Marketing Performance Metrics to Boost Growth
Written by LLMrefs Team • Last updated September 4, 2025
Digital marketing performance metrics are the numbers you track to see if your marketing is actually working. They're the specific, measurable data points that tell you whether your campaigns are hitting the mark or falling flat. Without them, you're just guessing. These metrics turn vague goals into hard numbers, showing you the real-world impact your work has on the business.
Beyond Numbers: What Digital Marketing Metrics Really Mean
It's easy to get lost in a sea of data. You log into your analytics dashboard and see a dizzying array of charts, percentages, and acronyms. The trick isn't to track every single number you can find, but to zero in on the ones that actually tell you something important about your business. This is where a deep understanding of digital marketing performance metrics gives you a serious edge.
Think of your marketing dashboard like the cockpit of an airplane. Some dials are nice to look at but aren't essential for a safe flight—those are your vanity metrics.
Vanity Metrics: These are the numbers that look great on a slide deck but don't necessarily connect to your bottom line. Think social media 'likes' or total impressions. Practical Example: A B2B software company's LinkedIn post gets 10,000 likes but generates zero demo requests. The likes are a vanity metric; the demo requests are what matter.
Actionable Metrics: These are the critical gauges showing your altitude and fuel levels. We're talking about things like Cost Per Acquisition (CPA) and Customer Lifetime Value (CLV). Actionable Insight: If your CPA is rising month-over-month, it’s a signal to re-evaluate your ad targeting or landing page copy.
Connecting Metrics to Business Objectives
The most powerful marketing strategies tie every single metric back to a core business goal. Data without context is just noise. To truly understand your impact, you need to learn how to measure marketing effectiveness by moving past surface-level stats. Every metric should help answer a fundamental business question.
For instance, if your main objective is to grow revenue, you won't be obsessing over follower counts. Instead, your focus will be lasered in on Return on Ad Spend (ROAS) and Conversion Rate. These metrics tell you directly whether your marketing budget is turning a profit. Actionable Insight: If your ROAS is 2:1, you’re losing money after accounting for the cost of goods sold. You need to either improve ad performance or lower your ad spend.
The goal is to shift from a mindset of tracking activity to one of measuring results. An effective strategy isn't about being busy; it’s about driving measurable progress toward specific, high-value business goals.
Ultimately, your metrics should tell a clear story about your customer's journey and the health of your business. They're the language you use to justify your budget, prove your value, and build a marketing engine that doesn't just run—it wins. This guide will give you the vocabulary and framework to speak that language fluently.
Decoding Your Website and Traffic Performance

Think of your website as your digital storefront. It’s where your brand lives online. In this analogy, website traffic metrics are the footsteps of potential customers walking through the door. But just counting the number of people who show up doesn't tell you the full story.
The real gold is in understanding how they found you and what they do once they're inside. This is the bedrock of modern marketing. One of the most fundamental digital marketing performance metrics is still website traffic because it’s the clearest starting point for measuring the impact of your efforts.
Smart businesses don’t just look at the total number of visitors. They break it down by source—organic search, paid ads, social media, direct visits—to see what’s working and what’s not. Consistent, high-quality traffic growth almost always leads to more opportunities and a better return on your marketing spend.
Understanding Your Traffic Sources
Not all website visitors are the same. Pinpointing where your traffic comes from is the first real step toward figuring out which of your marketing channels are actually delivering.
Organic Search Traffic: These are the people who find you "naturally" through a search engine like Google or Bing. They typed in a query, saw your site in the results (not an ad), and clicked. High organic traffic is a fantastic sign that your SEO and content strategy are hitting the mark. It's the gift that keeps on giving.
Paid Traffic: This is anyone who clicks on an ad you paid for, whether it's a Google Ad or a boosted post on Facebook. This traffic is fast and you can control it precisely, but the moment you stop paying, the visitors stop coming.
Referral Traffic: These visitors clicked a link on another website to get to yours. A healthy flow of referral traffic means other sites in your niche see you as a credible source. That’s a powerful signal to both users and search engines.
Breaking down your traffic this way helps you answer the big questions. Actionable Insight: By filtering your traffic in Google Analytics, you might discover that a single guest post on a popular industry blog (Referral Traffic) is sending more qualified leads than your entire paid ad campaign. This tells you to invest more in content partnerships.
Measuring What Users Do Next
Getting someone to your website is only half the job. The other half is figuring out what they do once they arrive. Do they stick around and explore, or do they hit the back button immediately? User behavior metrics open a window into how people really feel about your site’s content and design.
A high bounce rate isn't just a bad number on a report. It’s a clear message from your audience: "This isn't what I was looking for." It’s your cue to take a hard look at your content, your ad targeting, or your page layout.
Two of the most telling metrics are:
Bounce Rate: This is the percentage of people who land on a page and leave without doing anything else—no clicks, no scrolling to another page, nothing. Practical Example: A product page has an 85% bounce rate. This is an immediate red flag. You should investigate if the page loads too slowly, if the price is unclear, or if the "Add to Cart" button is broken.
Average Session Duration: This simply measures how long, on average, people spend on your site in a single visit. Longer sessions usually mean your content is grabbing their attention and giving them what they came for.
By tracking these digital marketing performance metrics, you can stop guessing and start making informed decisions. To get a handle on all this data, check out our guide on the most essential digital marketing analytics tools.
Connecting Marketing Actions to Real Revenue
Website traffic and engagement stats are great for telling you who’s showing up at your digital storefront. But the real gut-check for any marketing effort is whether those visits actually turn into money. This is where we stop just observing activity and start measuring real financial impact. If you want to prove your value, you need to speak the language of business, and that means mastering the digital marketing performance metrics that tie directly to the bottom line.
These are the numbers that connect your campaigns to revenue, answering the one question every executive and business owner cares about: "What did we get back for the money we spent?" Understanding metrics like Conversion Rate, Cost Per Acquisition, and Return on Ad Spend helps you build a rock-solid, data-backed case for your marketing budget and strategy.
Calculating Your Conversion Rate
Let's start with the most fundamental economic metric: your Conversion Rate. It’s simply the percentage of visitors who take a specific, desired action. This is how you measure your effectiveness at turning passive browsers into active leads or paying customers.
That "action" could be anything that moves someone down the funnel. It might be filling out a contact form, signing up for a newsletter, or, the holy grail, making a purchase.
The formula couldn't be simpler:
Conversion Rate = (Number of Conversions / Total Number of Visitors) x 100
Practical Example: If an e-commerce landing page got 5,000 visitors last month and 200 of them bought a product, your conversion rate is 4%. Actionable Insight: If you run an A/B test and a new headline increases conversions to 250, your conversion rate jumps to 5%. That's a 25% increase in sales from a simple copy change.
Understanding Your Acquisition Costs
Knowing how many people convert is a great start, but the story is incomplete until you know how much it costs to earn each of those conversions. This brings us to a couple of crucial, cost-related metrics.
Cost Per Acquisition (CPA): This tells you, on average, what you pay to land a single new customer. Practical Example: You spent $1,000 on a Google Ads campaign that resulted in 20 new customers. Your CPA is a neat $50.
Return on Ad Spend (ROAS): This one measures the gross revenue you generate for every single dollar you put into advertising. The formula is (Total Revenue from Ads / Total Ad Spend). Practical Example: If that same $1,000 campaign brought in $5,000 in revenue, your ROAS is 5x (or 500%).
You can’t look at these numbers in a vacuum. A high ROAS on one channel might completely justify a higher CPA. Actionable Insight: A LinkedIn campaign might have a CPA of $150, while a Facebook campaign’s is only $40. But if those LinkedIn customers spend ten times more over their lifetime, that higher acquisition cost is a no-brainer. This insight tells you to allocate more budget to LinkedIn, despite the higher initial cost.
To help you get a sense of how all the data for these calculations comes together, the infographic below shows how different tracking tools fit into the bigger picture.
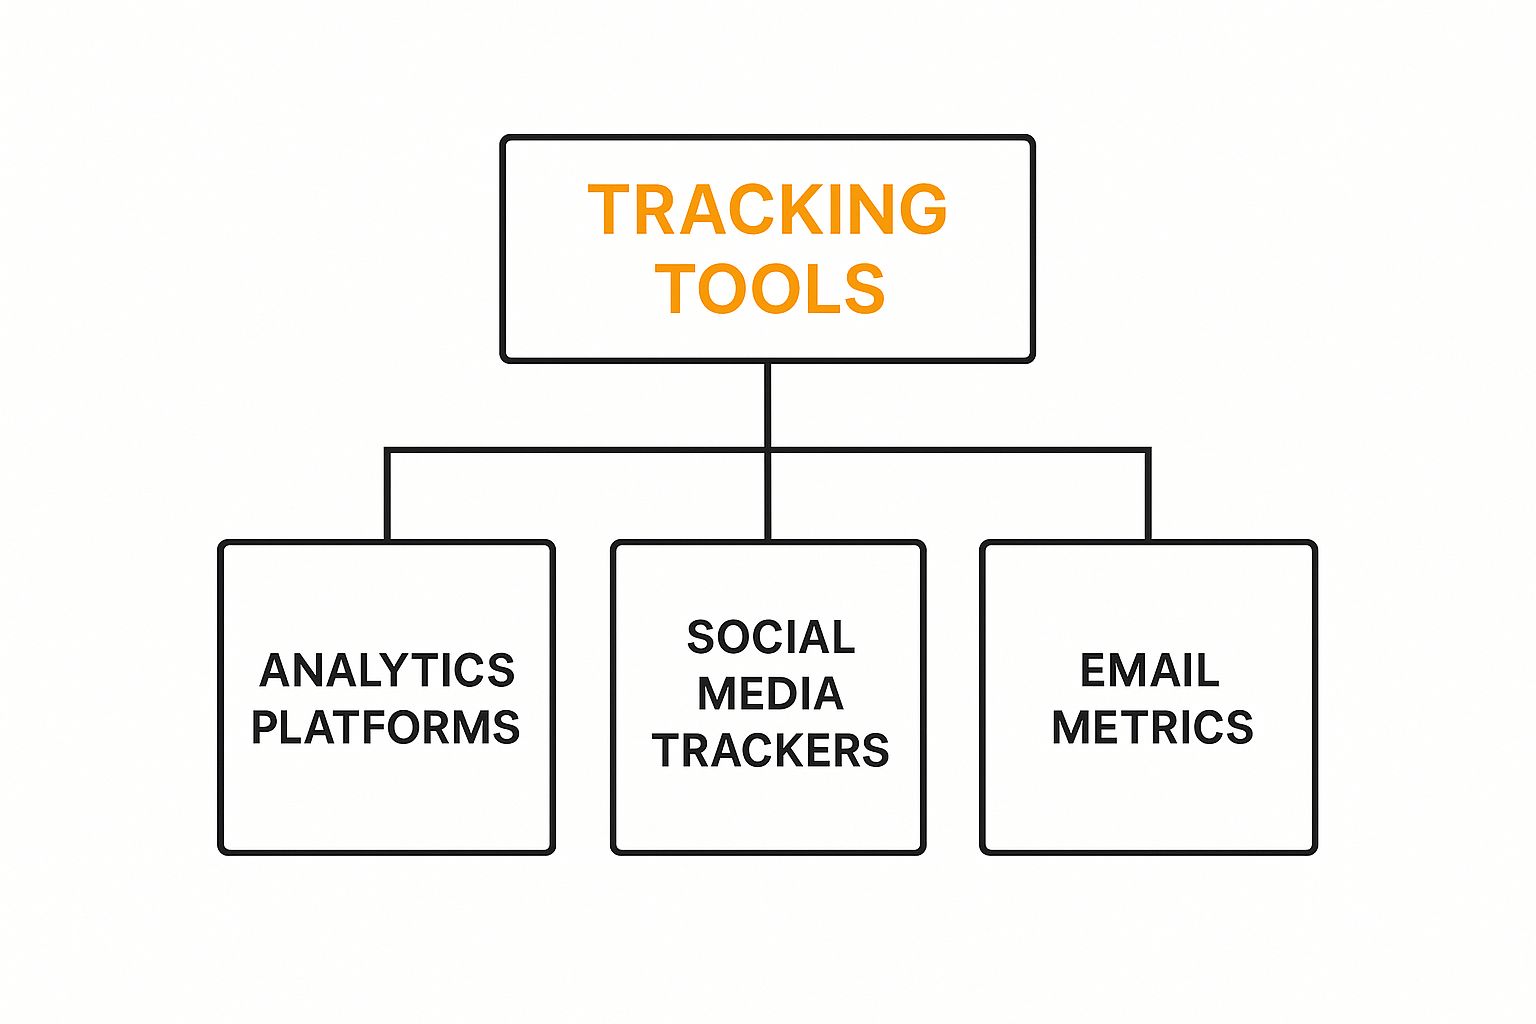
As you can see, broad analytics platforms form the foundation, while more specialized tools for social media and email provide the granular, channel-specific data you need to calculate an accurate ROI.
To make these concepts even clearer, here’s a quick-reference table breaking down the core economic metrics.
Core Economic Metrics Calculation and Importance
| Metric | How to Calculate It | Why It Matters |
|---|---|---|
| Conversion Rate | (Total Conversions / Total Visitors) x 100 | Measures the raw effectiveness of your website or landing page at persuading visitors to take action. It's a direct reflection of your messaging and user experience. |
| Cost Per Acquisition (CPA) | Total Marketing Spend / Number of New Customers | Tells you exactly what it costs to acquire one new customer. This is crucial for budgeting and understanding the efficiency of your marketing channels. |
| Return on Ad Spend (ROAS) | Total Revenue from Ads / Total Ad Spend | Shows the direct financial return for every dollar spent on advertising. It’s the ultimate measure of an ad campaign’s profitability. |
| Customer Lifetime Value (CLV) | (Average Purchase Value x Average Purchase Frequency) x Average Customer Lifespan | Predicts the total profit a customer will generate over their entire relationship with your business. It’s the key to making smart, long-term acquisition decisions. |
This table provides a snapshot, but the real power comes from using these metrics together to inform a cohesive and profitable marketing strategy.
The Long-Term View with Customer Lifetime Value
While CPA and ROAS are fantastic for gauging the immediate punch of a campaign, the most successful marketers play the long game. That's where Customer Lifetime Value (CLV) comes in. This metric forecasts the total net profit you can expect to make from an average customer over the entire course of their relationship with your brand.
It’s a complete perspective shift—from focusing on a single transaction to valuing the entire customer journey.
Understanding CLV is the secret to sustainable growth because it tells you exactly how much you can responsibly afford to spend to acquire a new customer. Practical Example: If you know the average customer brings in $1,200 in profit over their lifetime, a $150 CPA doesn't just look reasonable; it looks like a fantastic investment. This data gives you the confidence to outbid competitors on ad platforms.
The Customer Acquisition Cost (CAC), which is closely related to CPA, is a pivotal metric companies use to assess their marketing efficiency. Smart businesses are constantly finding new ways to optimize this cost. For example, a recent trend shows that 47% of brands are now focusing more on attention and engagement metrics rather than just clicks, aiming to acquire more valuable, long-term customers from the start. You can explore more insights on how AI is impacting these metrics over at TodayDigital.com.
Measuring Real Engagement in Content and Social Media

It’s easy to get excited by a high follower count, but let's be honest—it doesn't pay the bills. In the world of content and social media, vanity metrics like likes and followers are the simplest numbers to track, but they often tell you the least about what’s actually working.
Real success is measured by genuine connection. You need to focus on the digital marketing performance metrics that show you how deeply your message is resonating. It’s the difference between someone mindlessly scrolling past your post and someone stopping to save it, share it with a friend, or leave a thoughtful comment. Those are the actions that signal a true connection and are far better predictors of a future customer.
Beyond Likes: The True Meaning of Engagement Rate
Your best tool for measuring this connection is the Engagement Rate. It’s a powerful metric that bundles the most meaningful interactions—comments, shares, and saves—into a single, telling percentage. A high engagement rate is proof that your audience doesn't just see your content; they value it.
Practical Example: A small business posts two updates on Instagram:
- Post A gets 500 likes, but only 2 shares and 5 comments.
- Post B gets 200 likes, but also gets 50 shares and 30 comments.
At first glance, Post A might seem more successful. But Post B is the clear winner. It sparked conversations and was so valuable that people felt compelled to pass it along. That’s the kind of content that builds a real community and drives business forward.
When you analyze which posts earn the most shares and comments, you get a direct roadmap for your content calendar. It takes the guesswork out of content creation by telling you exactly what your audience wants to see more of.
Clarifying Content Visibility: Reach vs. Impressions
Another common point of confusion is the difference between Reach and Impressions. People often use them interchangeably, but they measure two very different aspects of your content’s visibility.
- Impressions: This is the total number of times your content was displayed on a screen. If one person sees your post three times, that’s three impressions.
- Reach: This is the number of unique people who saw your content. If that same person sees your post three times, your reach is still just one.
Actionable Insight: A Facebook ad shows high impressions but low reach. This means a small group of people are seeing your ad repeatedly, which can lead to "ad fatigue." This insight tells you to either broaden your targeting audience or refresh your ad creative to avoid annoying potential customers.
Measuring What Matters in Content Marketing
This focus on meaningful interaction goes way beyond social media. For all your content marketing, you need to measure the actions that show genuine interest and intent.
Here are a few key metrics to watch:
- Scroll Depth: On a blog post, what percentage of readers actually make it 75% of the way down the page? This tells you if your writing is actually holding their attention.
- Download Rate: For an ebook or whitepaper, how many people who see the landing page follow through and download it? This is a direct measure of how valuable your offer is.
- Time on Page: This is a great indicator for individual pieces of content. A longer time spent on a complex article is a strong signal that you’re hitting the mark.
By zeroing in on these deeper metrics, you shift from simply broadcasting a message to building an engaged community that actively contributes to your growth.
How to Build Your Own Marketing Measurement Plan
Tracking digital marketing performance metrics without a clear plan is like collecting puzzle pieces with no picture on the box. You end up with a lot of interesting parts, but no real idea how they fit together to create the big picture.
Raw data on its own is just noise. It only starts to mean something when you frame it with a strategy. A solid measurement plan is what turns those raw numbers into a clear roadmap, guiding your decisions and saving you from drowning in data that doesn't matter.
Building this plan isn't nearly as complicated as it sounds. The best ones are simple, focused, and tied directly to what your business is actually trying to accomplish. Think of it as a repeatable framework that ensures every metric you track serves a real purpose, moving you from just collecting data to actively improving your strategy.
Start with Your Business Objectives
Before you even think about opening a report or looking at a chart, you have to answer one fundamental question: What is the primary goal here?
Every great measurement plan starts with your big-picture business objectives, not with the metrics. Choosing metrics first is a classic mistake, and it's the fastest way to get bogged down in "analysis paralysis," where you have tons of data but no clue what to do with it.
Practical Example: Instead of a vague goal like "get more leads," a specific objective is "Generate 500 new, qualified leads for the sales team from our blog content in Q3." This clarity makes it easy to choose the right metrics.
Your business objective is your destination. Your digital marketing performance metrics are the specific, turn-by-turn directions on your GPS that tell you if you're on the right path to get there. Without the destination, the directions are meaningless.
Select Your Key Performance Indicators
Once your objective is locked in, you can pick a small, powerful handful of Key Performance Indicators (KPIs). It's important to remember that not all metrics are KPIs. A true KPI is a number that directly shows your progress toward that specific business goal you just defined.
To keep things focused, you should aim for no more than 3-5 primary KPIs for any single objective.
Here’s what that looks like in the real world:
- Objective: Increase e-commerce revenue by 15%.
- KPIs: Conversion Rate, Average Order Value (AOV), Return on Ad Spend (ROAS).
- Objective: Generate more qualified leads for the sales team.
- KPIs: Marketing Qualified Leads (MQLs), Cost Per Lead (CPL), Lead-to-Customer Rate.
- Objective: Improve customer retention and loyalty.
- KPIs: Customer Lifetime Value (CLV), Churn Rate, Net Promoter Score (NPS).
Keeping your KPI list short and sweet ensures your team stays zeroed in on the numbers that actually move the needle. This is how you avoid getting distracted by "vanity metrics" that look nice but don't drive real business outcomes.
Establish a Reporting Rhythm and Choose Your Tools
With your objectives set and your KPIs chosen, the final piece is putting a system in place. This just means picking the right tools for the job and setting up a consistent reporting schedule. Your toolkit doesn't need to be fancy or expensive; it just needs to give you accurate data for the KPIs you've selected.
A simple, effective starter stack might look like this:
- Google Analytics 4: Your go-to for all website traffic and user behavior metrics.
- Your CRM (like HubSpot): Perfect for tracking how leads move through your funnel and what happens on the sales side.
- Native Social Media Analytics: Use the built-in tools on platforms like Facebook or LinkedIn for channel-specific engagement metrics.
Next, set up a simple dashboard—honestly, even a spreadsheet works great to start—that pulls your main KPIs into one spot. This becomes your single source of truth.
Then, decide on a reporting rhythm that makes sense for your team. Actionable Insight: A quick weekly check-in is perfect for fast-moving campaign metrics like ad spend and click-through rates. A deeper monthly review is better for spotting broader strategic trends, like which content themes are driving the most conversions over time. Once your plan is active and bringing people in, you can explore more advanced strategies in our guide on how to promote your site to keep that momentum going. This structured approach gives you the clarity you need to make confident, data-backed decisions.
From Data Points to Strategic Action

Let's be clear: tracking digital marketing performance metrics isn't about filling spreadsheets. It’s about taking smart, decisive action that pushes your business forward. Data is just the starting line; its real value is unlocked when you use it to make better choices.
Your metrics tell a story. They reveal what’s hitting the mark and what’s falling flat. When you organize them into key categories like traffic, revenue, and engagement, you start to see a clear narrative of your marketing performance. A solid measurement plan is the framework that turns this story into a strategic roadmap.
Your Final Action Checklist
The goal is to shift from passively watching your numbers to actively using them to make decisions. Here’s a simple checklist to help you get started right away:
- Look at your top five lowest-performing blog posts from this quarter. Can you update them with fresh information, tighten up the on-page SEO, or add a stronger call-to-action?
- Compare your Cost Per Acquisition (CPA) by channel every three months. It's time to shift your budget away from the expensive, low-return channels and double down on what’s actually bringing in profitable customers.
- Analyze the engagement rates of your last ten social media posts. What topics or formats got the most shares and comments? Let that insight guide your next content calendar.
The ultimate goal is to create a continuous feedback loop where performance data directly informs your next strategic move. This approach ensures you are always adapting, improving, and fueling sustainable business growth.
In the end, mastering your metrics gives you the confidence to act. By letting data guide your strategy, you can consistently optimize for better results, making every decision a deliberate step toward your biggest business goals.
For those ready to take the next step and optimize their content for modern search, diving into AI search engine optimization is a great place to start.
Got Questions? We've Got Answers
Diving into digital marketing performance metrics can feel like learning a new language. Let's clear up a few of the most common questions to help you build a measurement strategy that actually works.
What’s the Difference Between a Metric and a KPI?
Think of it like this: your car's dashboard has dozens of gauges and lights—those are your metrics. They measure everything from the tire pressure to how much washer fluid you have left.
But the most important ones you glance at constantly are the speedometer, fuel gauge, and engine temperature. Those are your Key Performance Indicators (KPIs). They tell you if you're going to reach your destination safely and on time.
Practical Example: "Website visitors" is a metric. But if your goal is to book sales calls, then "qualified leads from organic search" is your KPI. All KPIs are metrics, but not all metrics are KPIs. The trick is to only elevate the most critical measures to KPI status so your team stays laser-focused on what moves the needle.
How Often Should I Check My Marketing Metrics?
There's no single right answer here—it really depends on what you're measuring. Some numbers change by the hour, while others need months to tell a meaningful story.
A good rule of thumb is to use a tiered review schedule:
- Weekly Check-in: Look at your operational metrics. Think ad spend, click-through rates, and website traffic. This is your chance to catch and fix any immediate problems before they get out of hand. Actionable Insight: On Tuesday, you see the CTR for a key ad campaign has dropped by 50%. You can investigate immediately and discover the link is broken, saving the rest of the week's budget.
- Monthly or Quarterly Review: This is for the big picture. Dive into strategic metrics like Customer Acquisition Cost (CAC), Customer Lifetime Value (CLV), and your overall marketing ROI. These numbers need more time and data to show you the true health of your marketing efforts.
Which Tools Are Essential for Tracking Performance Metrics?
You don't need a massive, complicated tech stack to get started. In fact, most businesses can get a fantastic view of their performance with just a few core tools.
So many people make the mistake of buying expensive, all-in-one software before they've even mastered the basics. Start simple, build a solid foundation with free or low-cost tools, and then expand as you grow.
Here’s what your foundational toolkit should look like:
- Google Analytics 4: This is non-negotiable. It’s your window into website traffic, how users behave on your site, and where your conversions are coming from.
- SEO Platforms: You'll need something like Semrush or Ahrefs to keep an eye on your keyword rankings, backlink profile, and overall search visibility.
- Native Social and Email Analytics: Don't overlook the powerful analytics built right into your tools. Platforms like Meta Business Suite and your email provider (think Mailchimp) give you incredibly valuable, channel-specific data.
Ready to track your brand's visibility in the new era of AI search? LLMrefs is the essential tool for measuring your performance on platforms like ChatGPT, Perplexity, and Google AI Overviews. Start monitoring your Generative Engine Optimization (GEO) strategy today at https://llmrefs.com.
Related Posts

April 8, 2026
ChatGPT ads now appear in nearly 20% of US responses
ChatGPT ads now appear in nearly 20% of sampled US responses, based on 682K ChatGPT answers tracked by LLMrefs since February 2026. See who is buying, how fast ads are growing, and how we measure it.

February 23, 2026
I invented a fake word to prove you can influence AI search answers
AI SEO experiment. I made up the word "glimmergraftorium". Days later, ChatGPT confidently cited my definition as fact. Here is how to influence AI answers.

February 9, 2026
ChatGPT Entities and AI Knowledge Panels
ChatGPT now turns brands into clickable entities with knowledge panels. Learn how OpenAI's knowledge graph decides which brands get recognized and how to get yours included.

February 5, 2026
What are zero-click searches? How AI stole your traffic
Over 80% of searches in 2026 end without a click. Users get answers from AI Overviews or skip Google for ChatGPT. Learn what zero-click means and why CTR metrics no longer work.