statistical significance, ab testing, p-value, confidence interval, sample size
Statistical Significance in AB Testing: What It Means
Written by LLMrefs Team • Last updated November 16, 2026
Your checkout test shows more purchases for variant B, and Friday's planning meeting is approaching. The dashboard looks encouraging, but you still need to decide whether to ship the redesign, keep collecting evidence, or leave the checkout alone.
Statistical significance in A/B testing helps you evaluate evidence, not make the whole business decision. A useful verdict combines the estimated lift, the uncertainty around it, and the cost of acting. That's how you turn a promising dashboard into a defensible ship, hold, or retest decision.
How to Read an A/B Test Result at a Glance
Say you've simplified the checkout form. Variant B converts better than the original, but your product manager needs more than a green indicator before assigning engineering time.
Read the report in this order:
- Estimated lift: How much better or worse did the variant perform? Record both the absolute difference in percentage points and the relative change against the control.
- Confidence interval: How wide is the plausible range of effects? Check whether it includes no improvement, a harmful decline, or gains too small to matter.
- P-value: Does the result meet the statistical threshold chosen before launch?
The following hypothetical dashboard patterns illustrate how to read those fields. They aren't reconstructed outputs from a single statistical model, and exact relationships between p-values and intervals depend on the method used.
Reading an A/B test result by its numbers
| Result pattern | P-value | Confidence interval for lift | Verdict |
|---|---|---|---|
| Clear winner | 0.03 | +0.4 to +3.2 points | Significant; lift likely positive |
| Not significant | 0.08 | -0.2 to +3.6 points | No proof of gain; keep testing or stop |
| Too wide to call | 0.20 | -0.5 to +4.1 points | Inconclusive; run longer or accept the risk |
| Significant but tiny | 0.01 | +0.05 to +0.12 points | Significant; check whether the lift justifies shipping |
Turn the pattern into a next step
The clear winner is a candidate for shipping, provided the experiment followed its plan and even a modest improvement would justify the implementation cost. Statistical evidence supports a positive effect; the cost check determines whether it's actionable.
The not significant and too wide to call patterns don't establish a gain. Continue only if you're still within the planned experiment, or design a fresh, more informative test. Don't extend a completed test indefinitely until it produces a favorable answer.
The significant but tiny result needs a different conversation. A small improvement might justify a simple copy change but not a checkout rebuild with ongoing maintenance.
Quick reading rule: Find the direction, inspect the range, then compare the potential benefit with the cost.
You can usually place a report into one of these patterns in under a minute. The important distinction is between identifying a pattern and authorizing a rollout.
What a P-Value Really Measures
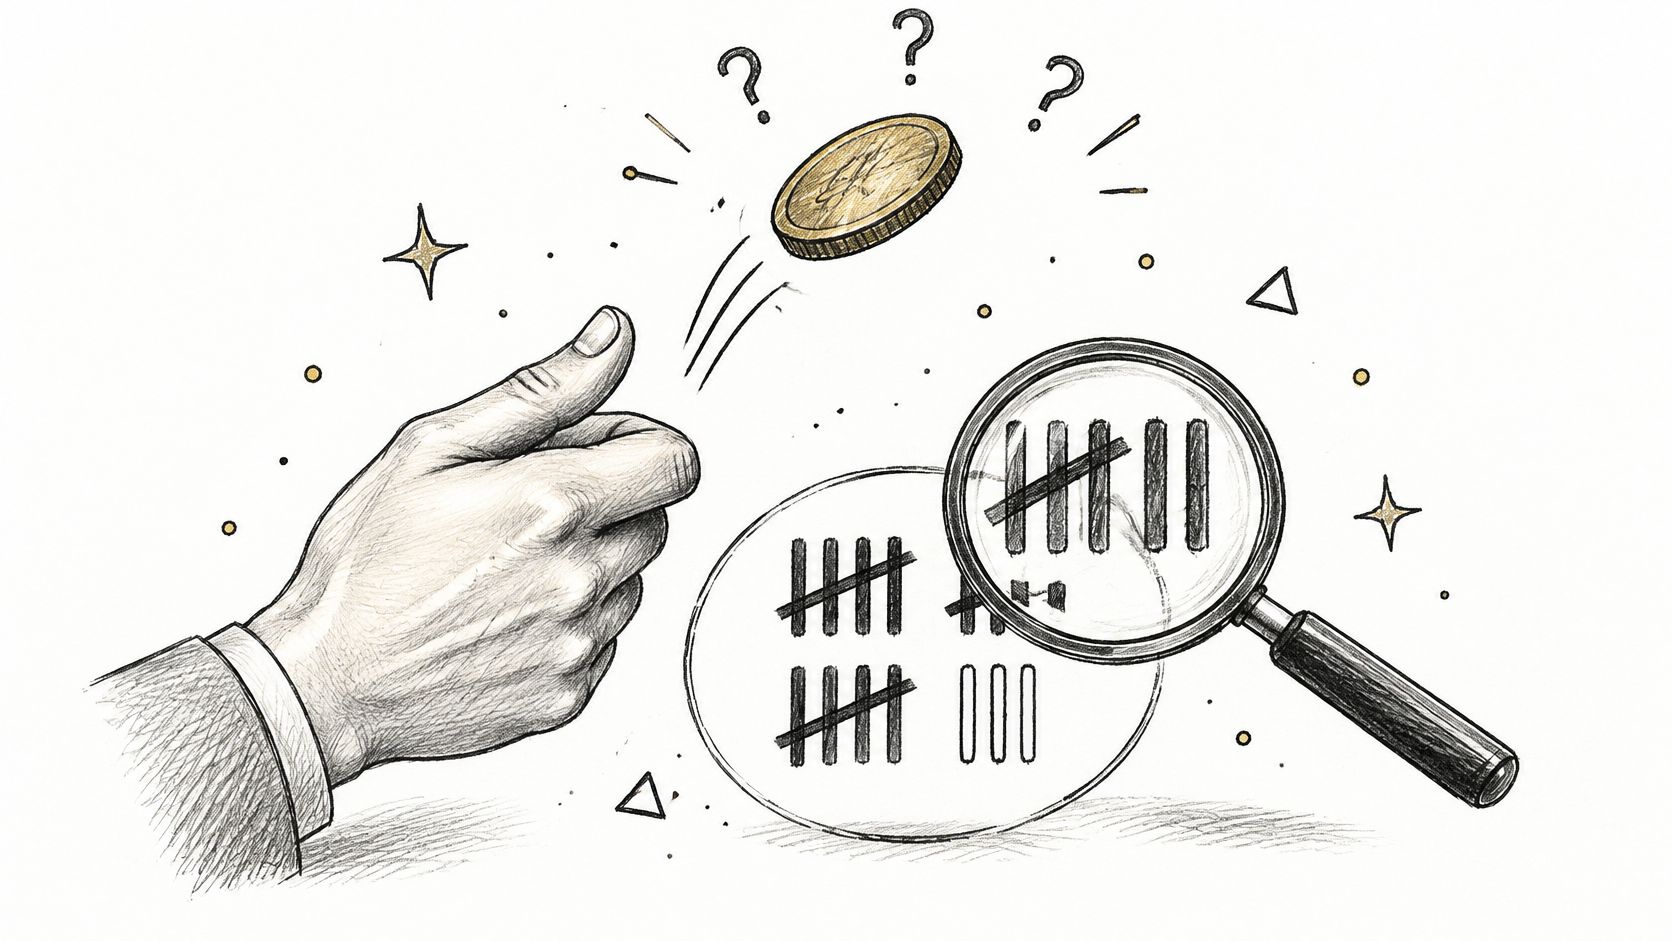
Suppose you flip a coin ten times and get eight heads. You might ask whether the coin is biased, but first consider a narrower question: how often would a fair coin produce a result this lopsided or more lopsided?
That's the logic behind a p-value. You temporarily assume there's no underlying difference, then ask how surprising the observed evidence would be under that assumption.
The coin example makes that starting assumption easier to see.
Start with no treatment effect
In a checkout experiment, the null hypothesis says the redesign has no treatment effect. The p-value is the probability of observing results at least as extreme as those measured if that null hypothesis were true.
It is not the probability that variant B is better. It also isn't the probability that the result is a fluke. Those interpretations reverse the question: the calculation assumes the null and evaluates the evidence, rather than assigning a probability to the null itself.
For a two-sided significance threshold of 0.05, repeated testing under a true null produces significant results about 5% of the time, as explained in the analysis of commercial website experiments. That same analysis estimated a false-discovery rate of 18–25% among significant findings, largely because approximately 70% of tested effects were null.
Why those error rates differ
The first rate concerns experiments where no real effect exists. The second concerns the findings that teams label significant.
If a team tests many changes that do nothing, it creates many opportunities for noise to cross the significance threshold. Those false winners can make up a meaningful portion of the apparently successful experiments.
For the checkout team, this means a favorable result deserves scrutiny, not automatic dismissal or automatic trust. A sound experiment is useful evidence, but it's never a guarantee.
Before launch, record:
- Primary metric: Define the purchase event and eligible population.
- Minimum detectable effect: Specify the effect size the experiment should be capable of detecting.
- Sample size: Calculate the required observations using the planned assumptions.
- Stopping rule: Decide when the result can support a decision.
Changing those choices after inspecting results can inflate false wins. Keep exploratory discoveries, but label them as ideas for a subsequent experiment rather than revising the original question.
Picking a Confidence Level and Significance Threshold
Choosing a significance threshold is a risk decision. A team testing a reversible checkout label can tolerate different uncertainty from a team changing payment routing or committing to an expensive migration.
The significance level, written as alpha, controls how often the procedure rejects a true no-difference hypothesis under its assumptions. NIST's hypothesis-testing guide explains that alpha = 0.05 means rejecting a true null about 5% of the time.
That isn't a guarantee that only that share of your shipped changes will be mistakes. It describes the testing procedure under a particular condition.
Significance levels and what they cost
| Significance level (alpha) | False-positive risk when nothing works | Confidence level | Trade-off |
|---|---|---|---|
| 0.10 | 10% | 90% | Faster reads and narrower intervals, but more false winners |
| 0.05 | 5% | 95% | Common default for most product and marketing tests |
| 0.01 | 1% | 99% | Fewer false winners, but needs more traffic and gives wider intervals |
These relationships assume a matching, valid test and interval procedure. Higher confidence means accepting a wider uncertainty range for the same observations.
The same result can pass one threshold and fail another
In a hypothetical checkout test, p = 0.03 passes a threshold of 0.10 or 0.05, but not 0.01. The observations haven't changed. The standard chosen for acting has.
That's why you shouldn't loosen the threshold after seeing a disappointing result. Doing so changes the decision rule in response to the evidence it was supposed to evaluate impartially.
Direction also matters. A two-sided test evaluates departures in either direction, which is useful when a checkout change could improve purchases or harm them. A one-sided test evaluates a specified direction and needs a defensible rationale established before exposure.
Don't choose one-sided testing because the variant currently looks better. It's defensible only when a decrease wouldn't alter the decision being tested, with potential harm addressed through appropriate safeguards.
Choose your threshold by weighing the cost of a false win against the cost of a missed win. Then write down both the threshold and the directional choice before launch.
Using Confidence Intervals to Size the Lift
A p-value doesn't tell your checkout team how much additional business to expect. For that, you need the estimated effect and a range that communicates its uncertainty.
A confidence interval gives a range of effects compatible with the observations under the statistical model. NIST's guidance on confidence intervals explains why an interval adds information about direction, magnitude, and practical importance that a hypothesis-test decision alone doesn't establish.
Use the interval as a measuring tool rather than a badge.
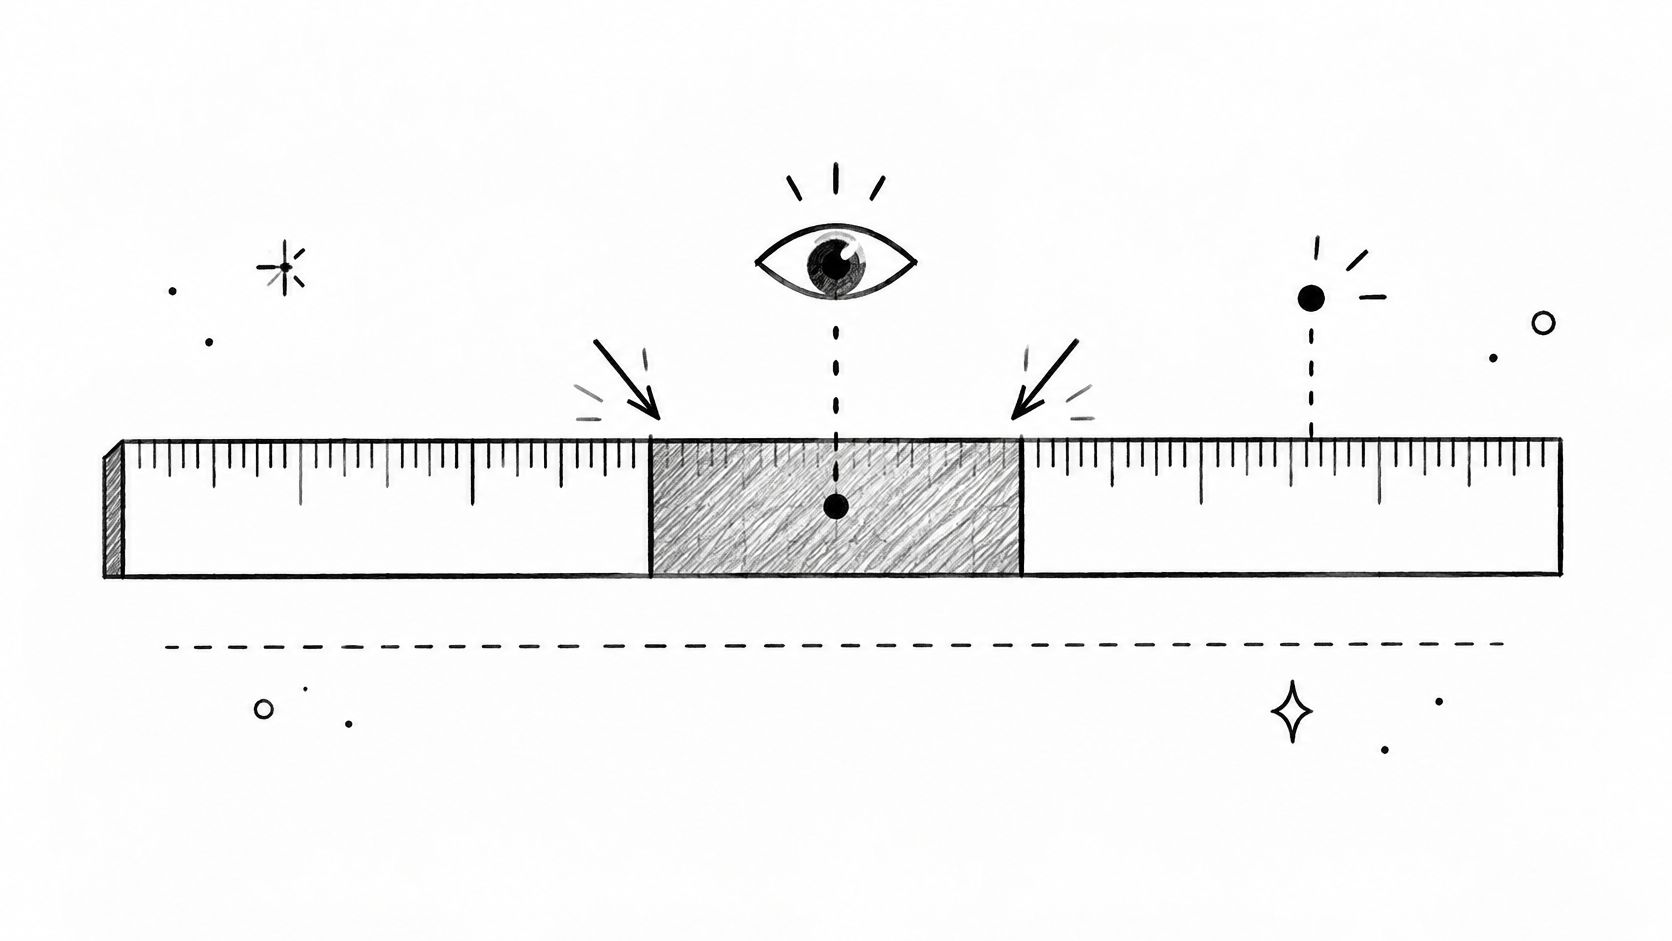
Read both ends, not just the midpoint
Consider a hypothetical result: version B raises conversion by an estimated 1.8 percentage points, with a 95% confidence interval from 0.4 to 3.2 points. The interval excludes zero, supporting a positive effect under a matching two-sided test.
The lower end still matters. If the gain is close to that lower bound, would the redesign pay for itself? The midpoint is your estimate, not a promise.
Now suppose the interval instead runs from -0.5 to +4.1 points. That hypothetical result leaves room for a decline, no effect, and a worthwhile improvement. The useful conclusion is that the estimate is too imprecise to distinguish those possibilities.
Avoid interpreting a frequentist interval as a probability distribution for the true effect. Its confidence level describes the long-run coverage of the interval-building procedure, assuming the method is valid.
Keep units and uncertainty visible
Absolute lift is the variant conversion rate minus the control rate. Relative lift divides that difference by the control rate. They describe the same comparison in different units, so label them clearly rather than writing an ambiguous percentage improvement.
A decision-ready report should include:
- Control rate: The original checkout's measured conversion rate.
- Variant rate: The redesigned checkout's measured conversion rate.
- Absolute lift: The difference in percentage points.
- Relative lift: The change relative to the control.
- Confidence interval: The range for the lift, with units and confidence level.
- Sample size: The eligible observations in each arm.
- Decision threshold: The minimum business benefit agreed before launch.
More observations generally improve precision, while a higher confidence requirement widens the interval for the same data. Neither choice removes uncertainty entirely.
Ask whether the lower bound would still justify the change, not whether the midpoint looks attractive on a slide.
How Much Traffic and Time Your Test Needs
Calculate sample size before launch, not after the dashboard becomes interesting. Your inputs should reflect the business question and the sensitivity required to answer it.
Start with the baseline conversion rate, the minimum detectable effect, and statistical power. Power is the probability of detecting an effect of the specified size when that effect exists. It is not the probability that a significant result is correct.
Use this planning sequence before assigning a launch date.
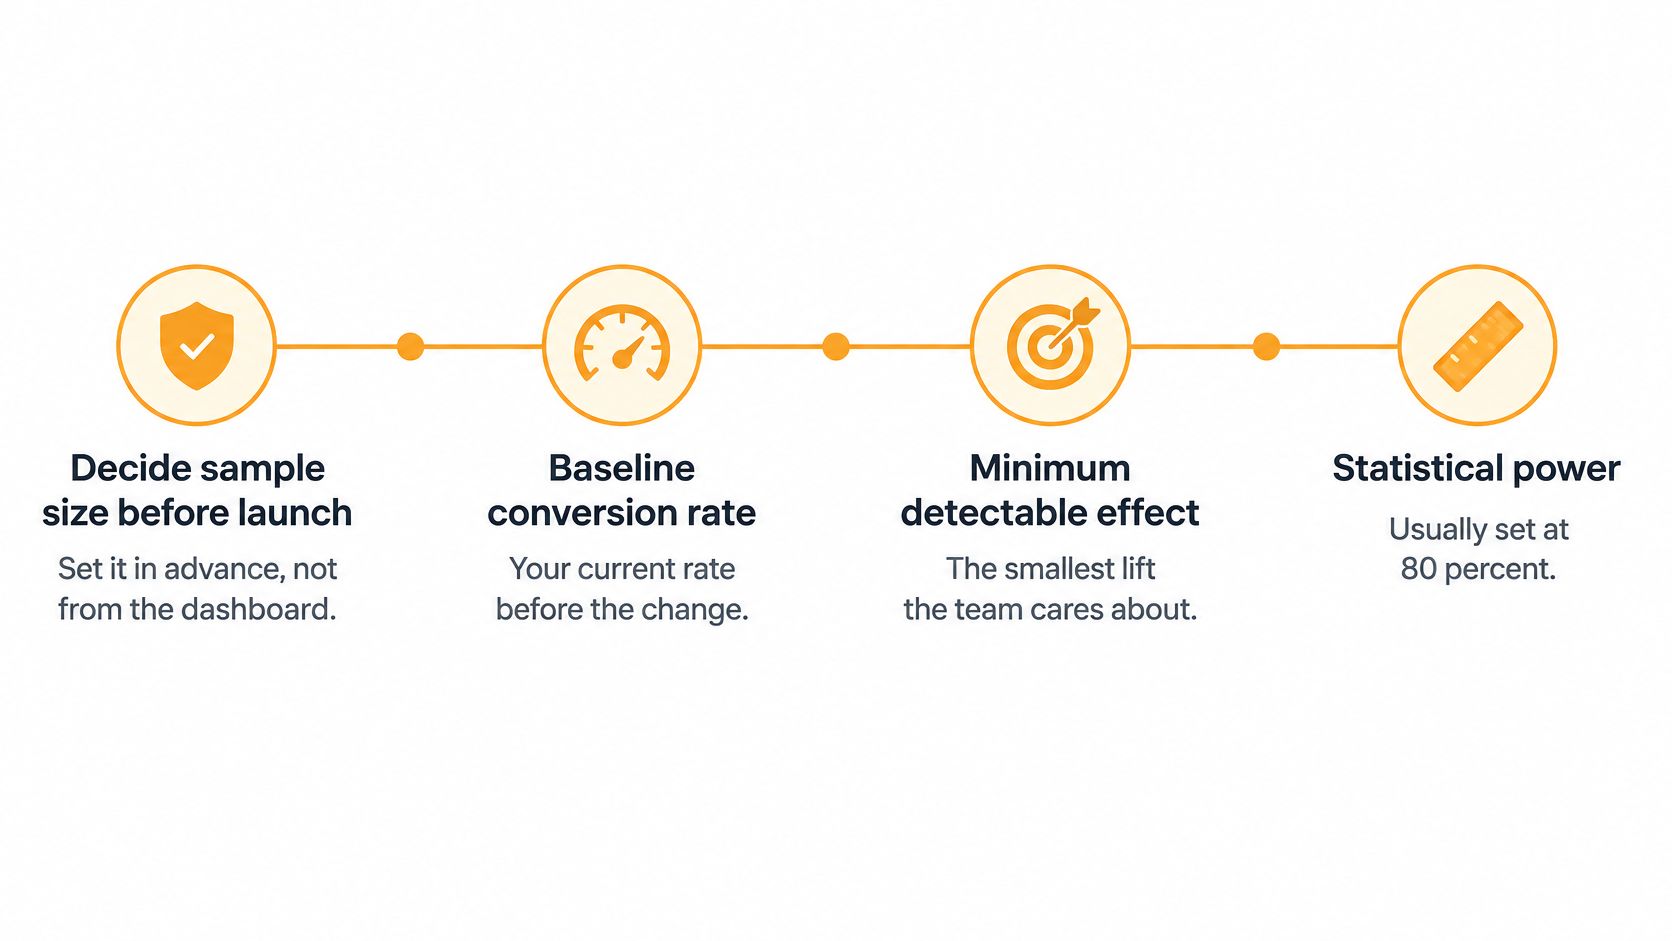
Translate sensitivity into a schedule
The following is a hypothetical planning example, using a baseline conversion rate of 5%, 95% two-sided confidence, and 80% power. Treat the traffic estimates as illustrative calculator outputs, not universal requirements; your chosen method and assumptions determine the final target.
Visitors and days needed to detect a lift at a 5% baseline
| Relative lift to detect | Absolute change (5% baseline) | Visitors per variant | Days at 1,000 visitors per variant per day |
|---|---|---|---|
| 20% | 1 percentage point | 8,200 | 9 |
| 10% | 0.5 percentage point | 31,000 | 31 |
| 5% | 0.25 percentage point | 124,000 | 124 |
Read the table row by row. The 20% row is the cheapest question: roughly 8,200 visitors per variant, or about nine days at the assumed pace. Ask for a 10% lift and the target rises to roughly 31,000 visitors and a month. Ask for 5% and it rises to roughly 124,000 visitors and four months. Each step down in detectable effect raises both the traffic bill and the calendar cost, which is why a launch date set before this calculation is a guess.
Optimizely's experiment-duration guidance recommends calculating fixed-horizon sample requirements in advance and waiting until both the required sample and minimum duration are reached. A guide to sample size considerations can help you structure those planning choices.
The decision at this stage is practical: run, resize, or hold. If the required traffic and days fit your calendar, proceed. If they do not, test a larger change or accept that the result will be too imprecise to support a ship decision.
Add evidence and calendar guardrails
Optimizely's significance documentation requires at least 100 visitors or sessions and 25 conversions in both the variant and baseline before declaring a winner for binary metrics. That is a platform-specific minimum, not a substitute for power analysis.
For example, a hypothetical checkout test with 8 purchases from 100 control visitors and 12 from 100 variant visitors would not meet that conversion guardrail. An encouraging difference does not compensate for insufficient evidence.
You can also improve sensitivity by reducing noise. The CUPED paper reports variance reductions of approximately 45%, 52%, and 49% in Bing experiments, described as roughly equivalent to doubling traffic.
CUPED uses relevant pre-experiment measurements, such as a keyword's baseline mention rate, to adjust for predictable variation. Prespecify the model and use only pre-treatment information; post-treatment adjustment can bias the comparison.
For another explanation of experiment planning, use the video below.
Before launch, lock the following:
- Measurement: Hypothesis, primary metric, eligibility, and baseline.
- Sensitivity: Detectable effect, power, significance threshold, and sample target.
- Execution: Traffic allocation, minimum runtime, stopping rule, and any adjustment model.
For a checkout with a weekly trading rhythm, a practical plan might require two complete weeks to represent weekday and weekend behavior. Set a launch date and an earliest evaluation date, then evaluate only after both the calendar requirement and sample target are satisfied.
Avoiding False Winners from Peeking and Multiple Tests
A marketer checks the checkout dashboard each morning. The variant looks weak, then promising, then weak again. When the indicator finally turns green, the team stops the test and announces a win.
The problem isn't opening a dashboard. It's using an unplanned favorable fluctuation as the stopping rule.
CustomFit's explanation of A/B testing mistakes estimates that daily checking over 20 days can produce roughly a 30% false-positive chance, rather than the nominal 5%. That estimate illustrates a particular repeated-checking scenario, not a universal rate for every dashboard.
More comparisons mean more opportunities to select noise
Suppose a team examines five metrics across ten audience slices. Even without changing the checkout again, it has created many opportunities to find a flattering result.
A mobile-only improvement in an exploratory segment may be worth investigating. It isn't automatically evidence that the team should ship a mobile-specific experience.
Choose an inference approach that matches how you'll work:
- Fixed-horizon testing: Evaluate once the planned sample and duration are complete. This is straightforward when the team can commit to waiting.
- Group-sequential designs: Schedule interim evaluations and use predefined stopping boundaries. Don't improvise the boundaries during the experiment.
- Always-valid inference: Use a method designed for continuous monitoring when frequent decision-making is necessary.
- False-discovery-rate control: Apply an appropriate procedure when investigating many comparisons and managing the proportion of false discoveries.
- A prespecified primary metric: Base the main decision on that metric and label additional slices as exploratory.
Make governance visible
Bonferroni correction can protect against false positives across a family of comparisons, but it can be overly conservative for large testing programs. When the comparison list grows, teams may lose sensitivity to effects worth investigating.
The right alternative depends on whether you're making a single rollout decision, screening ideas, or monitoring continuously. Have the analyst document the correction method and which comparisons belong to the same decision family.
For AI-search experiments, define the keyword set, model, country, language, and competitor comparisons before inspecting favorable slices. Also check that the observed allocation is consistent with the planned split and investigate tracking failures separately from performance.
Validity check: If early inspection changed when you stopped a conventional fixed-horizon test, treat the finding as provisional and confirm it in a fresh run.
Looking early for broken tracking or customer harm is different from looking early for permission to declare success.
Decide Whether a Significant Result Is Worth Shipping
Statistical significance and decision significance answer different questions. The first concerns evidence against a statistical hypothesis. The second asks whether the likely benefit justifies implementation, maintenance, and downside risk.
Statsig's discussion of A/B testing significance emphasizes that a low p-value doesn't supply effect size, financial impact, or implementation cost. A small, precisely measured gain can be commercially unimportant, while a potentially valuable gain can remain inconclusive.
Use this checklist as a decision aid, not as a substitute for evaluating the interval.
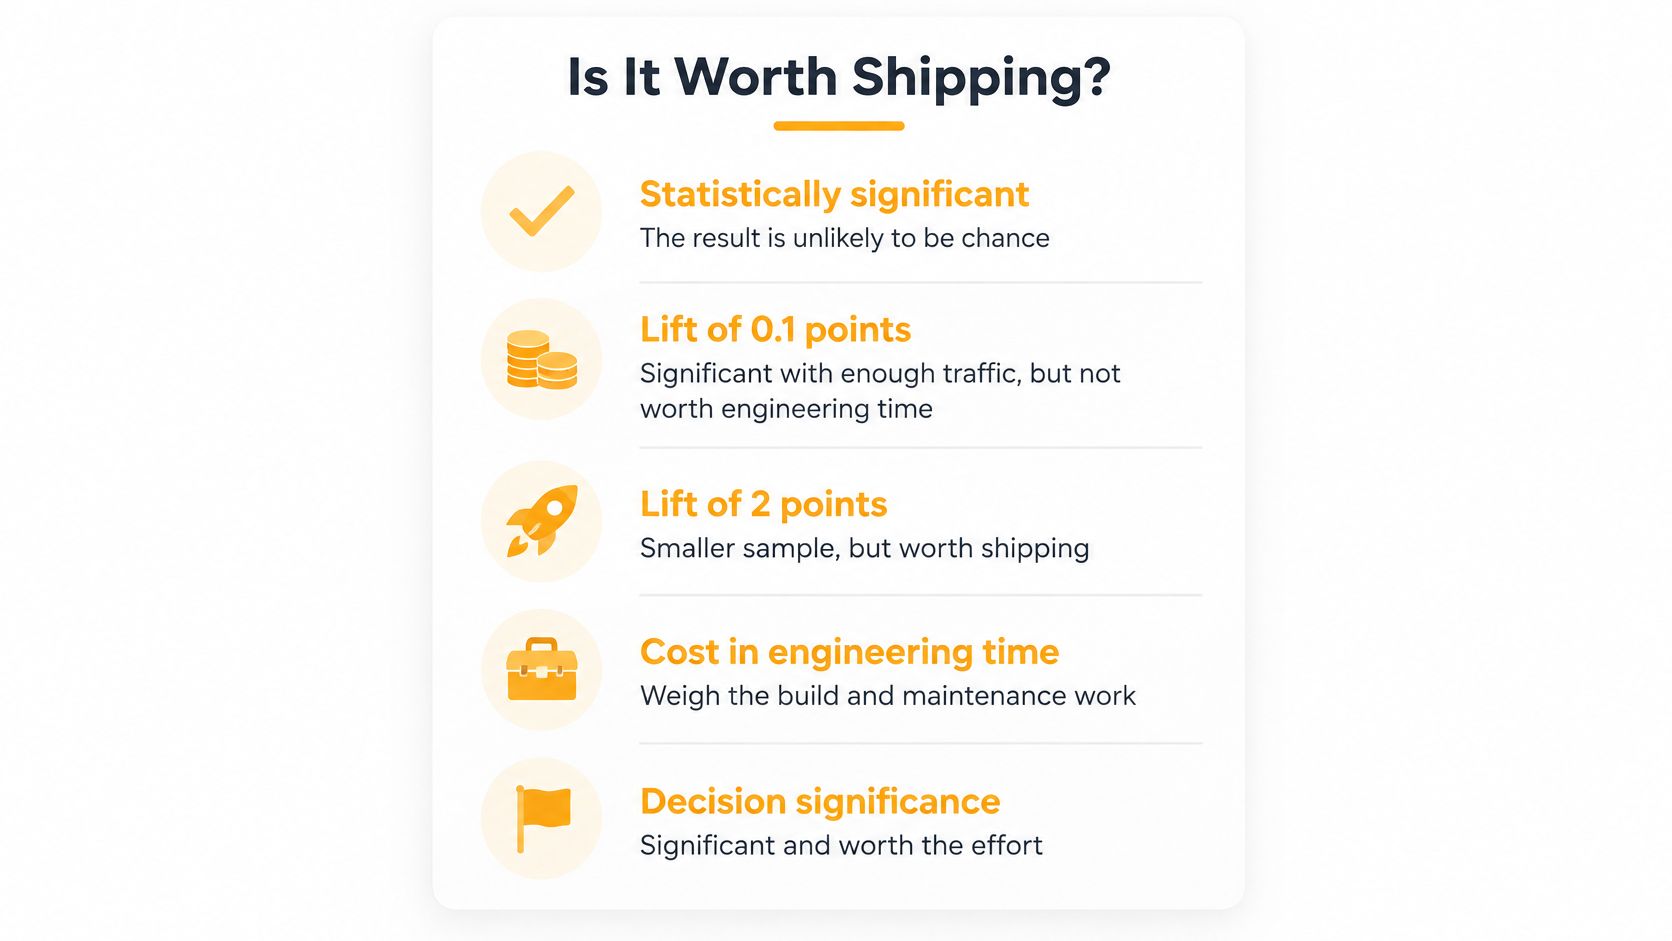
Compare the full range with the business threshold
In a hypothetical checkout plan, the team decides that 1 percentage point of absolute lift is the minimum benefit needed to justify a rebuild.
Scenario A: The estimated lift is 2 points, with an interval from 1.1 to 2.9 points. Even the lower bound clears the business threshold. If the experiment is valid and guardrails are acceptable, ship.
Scenario B: The estimate remains 2 points, but the interval runs from 0.4 to 3.2 points. The result supports improvement, but it doesn't establish that the benefit clears the commercial threshold. Retest, or explicitly document why the team accepts the economic risk.
Scenario C: The interval runs from -0.2 to +3.6 points. That doesn't prove there's no effect. A worthwhile gain remains plausible, so retest with greater sensitivity if the expected value of resolving the uncertainty exceeds the cost.
A hypothetical 0.1-point gain could be statistically significant yet fail the same business rule. In that case, hold the current checkout rather than spending engineering time to chase a technically positive result.
Record the decision, not just the result
Before approving the change, confirm:
- Primary metric: The decision uses the outcome specified before launch.
- Completed plan: Sample and runtime requirements were met.
- Economic value: Benefits justify build, maintenance, and opportunity costs.
- Downside exposure: Customer experience and operational guardrails remain acceptable.
- Decision record: The interval, threshold, action, and rationale are logged.
These habits help teams realize the practical benefits of A/B testing without treating every significant result as a rollout instruction.
For teams using LLMrefs, AI search results are checked in real time, and prompts are continuously checked to ensure statistical significance. We give customers stable, comparable visibility metrics instead of one-off screenshots, so teams can keep their decision log beside meaningful experiment results.
Before your next test starts, write the minimum worthwhile effect and the ship, hold, or retest rule into the test brief.
LLMrefs helps you track AI-search visibility through brand mentions, citations, and comparable performance metrics. Visit LLMrefs to establish your visibility baseline, identify a content change to test, and evaluate the result against a business threshold you've chosen in advance.
Related Posts

November 9, 2026
Claim your business in ChatGPT
A screenshot shows a "Claim your business in ChatGPT" page with mention and click tracking. We are skeptical it is real. If it is, it shares no prompts, no citations and no competitor data.

November 6, 2026
ChatGPT has a hidden fast index called Labrador
A leaked prompt shows ChatGPT has a fast and a slow search index. The fast one is Labrador, OpenAI's own index. It found a page Google, Bing and Brave never indexed.

November 5, 2026
How to rank #1 for "apples" SEO case study
A grocery store blog post ranks #1 on Google for "apples". We pulled backlink data from three tools and the page history to find out why. Some of it is unclear.

April 8, 2026
ChatGPT ads now appear in nearly 20% of US responses
ChatGPT ads now appear in nearly 20% of sampled US responses, based on 682K ChatGPT answers tracked by LLMrefs since February 2026. See who is buying, how fast ads are growing, and how we measure it.