marketing roi calculator, roi calculation, marketing roi, attribution models, llmrefs
Marketing ROI Calculator: Step-by-Step Guide & Template
Written by LLMrefs Team • Last updated October 5, 2026
A generally accepted digital marketing benchmark is a 5:1 return, but real profitability depends on calculating all-in costs, including team labor. Use the formula (revenue minus cost) divided by cost, multiplied by 100, then test whether the result still works after margin, labor, tools, and attribution are included.
What would your campaign ROI look like if the person managing it, the software stack, creative production, and delayed conversions were all charged to the same campaign? A conventional marketing ROI calculator often makes that question easy to ignore.
That's why two campaigns can show attractive revenue returns while producing very different business outcomes. One may create healthy contribution after costs. The other may consume hours, agency fees, and operational capacity that never appear in the spreadsheet. A useful calculator isn't just a formula. It's a controlled way to decide where the next dollar, hour, and production slot should go.
Why Most Marketing ROI Calculators Underestimate Returns
A familiar spreadsheet contains three cells: campaign cost, attributed revenue, and ROI. A team enters ad spend, imports conversions from an advertising platform, and sees a positive result. The campaign gets described as profitable, even though nobody has priced the strategist's time, landing page work, software subscriptions, creative revisions, sales follow-up, or the revenue that may have been assigned to the wrong channel.
The basic formula is still the right starting point:
Marketing ROI = ((Attributed revenue − marketing cost) ÷ marketing cost) × 100
For example, spending $10,000 and generating $30,000 in revenue produces 200% ROI, meaning the campaign returned two dollars for every dollar spent. That example and the core formula are outlined in HubSpot's marketing ROI calculator. The calculation is useful, but only if “marketing cost” means more than the media invoice.
Practical rule: Treat ad spend as one input, not as the complete cost base.
The costs that disappear from the spreadsheet
A campaign can look efficient when the business absorbs the work elsewhere. An in-house marketer may spend days briefing designers, cleaning lists, reviewing performance, and coordinating sales. A freelancer may produce the assets, while a marketing platform, analytics tool, form builder, and call-tracking service add recurring costs.
Creative production creates another blind spot. A campaign may use several ad variations, landing page changes, video edits, and sales enablement materials. If those costs sit in a general budget, the channel receives credit for revenue while another cost center carries the expense.
Delayed payback creates a different problem. A long sales cycle may produce qualified demand during the reporting period but revenue later. A calculator using a short window can undercount the eventual return, while a calculator that imports every later sale without a fixed rule can claim too much credit.
Why simple ROI became insufficient
The language of marketing ROI became more formal in the early 2000s, following Guy Powell's Return on Marketing Investment in 2002 and James Lenskold's Marketing ROI in 2003, as summarized in Sender's ROI statistics guide. Marketers needed a consistent way to compare channels with different payback profiles instead of relying on impressions, clicks, or instinct.
By 2026, some calculators had moved beyond isolated spreadsheet inputs. HubSpot reports that its model uses aggregated data from more than 306,000 customers globally, based on customers using Marketing Hub Professional or Enterprise for at least 12 months between January 2023 and March 2026. That development shows where calculators are heading, toward benchmarked decision systems rather than static arithmetic.
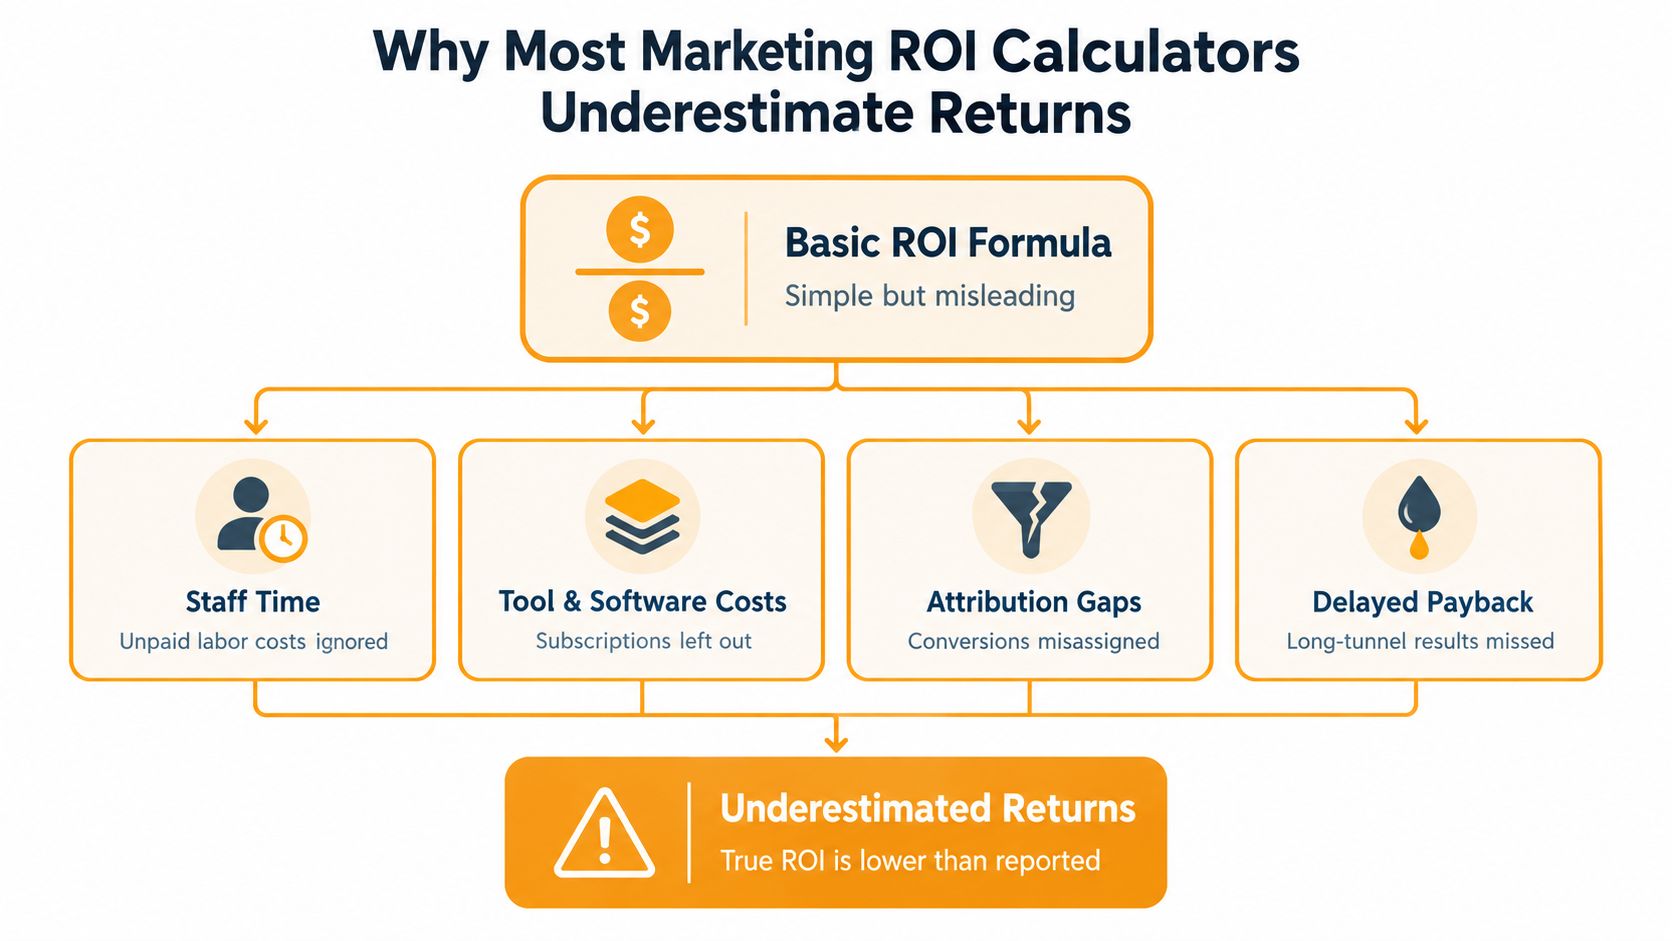
The strongest interpretation is not “the calculator is wrong.” It's that the calculator answers only the question its inputs allow it to answer. If you enter media spend and revenue, you get media-level revenue ROI. If you enter all-in cost and margin-adjusted revenue, you get a far more useful view of economic performance.
Setting Up Your ROI Framework and Inputs
Before opening a calculator, define the period, the channel, the conversion event, and the cost boundary. Otherwise, you'll compare figures that were never designed to fit together.
Start by choosing a fixed attribution window. A campaign might receive credit for a purchase, signed contract, or qualified lead only when that event occurs within the agreed period after an interaction. The exact window should reflect the sales cycle, but the important point is consistency. Apply the same rule to comparable campaigns before you compare results.
Build the cost base first
Include every cost required to create and convert demand:
- Media spend: Include paid search, social advertising, sponsorships, and other purchased placements.
- People: Assign a reasonable internal labor cost to planning, production, optimization, reporting, and sales follow-up.
- Technology: Add analytics, CRM, email, landing page, call tracking, testing, and reporting software.
- Production: Account for design, video, copywriting, photography, development, and campaign-specific revisions.
- Distribution and operations: Include events, printed materials, agency fees, and relevant overhead.
The marketing ROI calculator methodology from AnyRoad makes the important point that an all-in cost base and a fixed attribution window prevent inflated returns. Missing costs can make a campaign appear more efficient than it is, especially when a platform reports only the spend it controls.
Separate hard revenue from softer signals. Hard revenue includes tracked purchases, contract value, point-of-sale lift, or conversions tied to a CRM record. Softer signals include brand awareness, engagement, assisted visits, and improved consideration. Those signals matter, but they shouldn't be mixed into revenue ROI as if they were cash receipts.
A Brisbane service business, for example, may need to connect a phone inquiry, site visit, quote, and completed job before judging a campaign. A useful local example is this Brisbane tradie marketing case study, which provides context for thinking about marketing outcomes beyond a single click or lead form.
Create an input sheet
Use one row per channel and reporting period. Label each row with the campaign name, start and end dates, attribution rule, spend, labor, tools, production, attributed revenue, and gross margin. Add a notes field for missing data, refunds, duplicated leads, and revenue that sales has not yet confirmed.
For digital visibility, distinguish exposure from conversion. The digital marketing performance metrics guide can help your team organize leading indicators alongside commercial outcomes. That separation lets you report visibility as a contributing signal without pretending it is already booked revenue.
Finally, calculate a profit-based view. Revenue tells you what customers paid. Margin tells you what remains after the cost of delivering the product or service. A low-margin ecommerce campaign and a high-margin consulting campaign may show similar revenue ROI but produce very different contribution, so margin-adjusted analysis should guide budget decisions.
Comparing Attribution Models for Accurate ROI
Attribution changes the answer before the calculator does. The same customer may see a paid search ad, read an article, return through an email, speak with sales, and then convert. Each model assigns credit differently, so each can make a different channel appear responsible for the same outcome.
First-touch attribution
First-touch gives the conversion to the interaction that introduced the customer. It's useful for understanding demand creation and top-of-funnel acquisition. If organic content or a paid campaign brings a new prospect into the system, first-touch reporting can show which source opens the relationship.
Its weakness is obvious. It ignores the work that helped the prospect evaluate, return, and buy. A channel that introduces many prospects but rarely supports conversion may look more valuable than it is.
Last-touch attribution
Last-touch assigns credit to the final recorded interaction before conversion. It's easy to explain and works reasonably well for direct-response activity with a short decision path. A branded search click or remarketing visit may receive credit because it happened at the end.
The problem is that last touch often rewards the channel closest to the transaction. It can undervalue earlier content, referrals, events, and email nurturing. If the customer was already convinced before the final click, the model may confuse closing activity with demand creation.
Linear and position-based models
A linear model spreads credit across recorded touchpoints. This gives each interaction a role and can be useful when a team wants a balanced view rather than a single winner. Position-based models assign more credit to selected points, often the first and last interaction, while giving the middle touches less influence.
These models are easier to communicate than a fully statistical system, but they still depend on the completeness of the tracking. A missing phone call, offline conversation, or untagged referral creates a false impression of balance.
Multi-touch and incrementality
Multi-touch attribution uses a defined logic to distribute credit across several interactions. It can provide a richer operational view, particularly when CRM, analytics, advertising, and customer data are connected. It still shouldn't be treated as objective truth. The model's outputs depend on the events captured, the lookback rules, and the assumptions used to assign value.
Incrementality asks a different question: what additional outcome happened because marketing activity occurred? Holdout tests and controlled experiments can help answer that question, while attribution describes how recorded interactions share credit.
Measurement remains difficult. Nielsen-referenced data reports that 85% of marketers feel confident about ROI, while only 32% measure it across traditional and digital media globally, with the European figure at 23%. Another cited source says 47% struggle to measure ROI across multiple channels, as reported in Sci-Tech Today's marketing attribution statistics.
Attribution isn't a courtroom verdict. It's a measurement model with assumptions that need to be documented.
When platforms disagree, don't average the dashboards and call the result precise. Reconcile the conversion event, date range, deduplication rules, view-through treatment, and attribution window. Then report a primary model alongside a sensitivity view, such as first-touch, last-touch, and multi-touch results. If the decision changes depending on the model, that uncertainty belongs in the budget discussion.
Bridging Traditional ROI with AI Measurement
Traditional ROI works best when a customer action can be connected to revenue. AI search introduces an earlier measurement problem. A buyer may ask an answer engine for recommendations, encounter a brand mention or citation, and visit the site later through a path that doesn't preserve the original influence.
That doesn't make AI visibility impossible to measure. It means visibility metrics should sit beside revenue metrics instead of being forced into the same cell.

Add an evidence layer before the revenue layer
A practical AI measurement framework can track:
- Share of voice: How frequently a brand appears in relevant answer-engine responses.
- Citations: Which pages and sources answer engines reference.
- Brand mentions: Whether the brand appears in category, comparison, and recommendation conversations.
- Position signals: How prominently the brand appears relative to competitors.
- Commercial outcomes: Organic visits, assisted conversions, qualified leads, and revenue connected to the same topic set.
LLMrefs is a generative AI search analytics and LLM SEO platform that helps brands grow visibility inside AI answer engines by tracking share of voice, citations, and brand mentions across 20+ countries. That evidence can help a team identify whether its content is being discovered, cited, and associated with the subjects it wants to own.
The calculator should not automatically convert every mention into revenue. Instead, connect topic-level visibility to downstream behavior where tracking allows it. For example, a team can compare changes in cited content with branded searches, referral visits, assisted conversions, sales-qualified opportunities, and customer interviews. The result is a more honest chain of evidence, from visibility to consideration to revenue.
A short explainer can make the distinction clearer:
Use AI data to improve, not decorate, the calculator
AI measurement becomes useful when it changes an action. If competitor pages receive citations for a topic and your pages don't, the insight may justify a content update, stronger evidence, clearer authorship, or targeted outreach. If visibility rises but qualified demand doesn't, the team should inspect intent, offer fit, conversion paths, and attribution rather than celebrating the visibility metric alone.
This is the bridge between old and new measurement. The financial model remains grounded in cost, margin, and attributed commercial results. AI analytics adds an early diagnostic layer that helps explain why future demand may rise or fall, especially where answer engines influence discovery before a conventional analytics session begins.
Building Your Own Interactive ROI Calculator
A useful interactive calculator doesn't need a complicated interface. It needs disciplined inputs, visible assumptions, and outputs that a marketer and finance lead interpret the same way.
Start with a simple input structure:
- Campaign identity: Capture the channel, campaign name, market, and reporting period.
- Cost inputs: Record media, labor, software, production, agency, event, and relevant operating costs.
- Outcome inputs: Add attributed revenue, gross margin, refunds, cancellations, qualified leads, and closed opportunities where available.
- Measurement rules: Display the attribution model, conversion definition, and attribution window beside the result.
Then create separate outputs rather than one oversized score. Show revenue ROI, margin-adjusted contribution, cost per lead, cost per acquisition, conversion rate, and an attribution-confidence note. If a value is estimated, label it as estimated. If a cost is missing, show the omission instead of silently treating it as zero.
A practical template
Your spreadsheet or web form can use these fields:
| Input | Purpose |
|---|---|
| Channel and campaign | Identifies the activity being judged |
| Reporting dates | Keeps spend and revenue in the same period |
| Media cost | Captures purchased distribution |
| Internal labor | Prices the team's time |
| Tools and production | Captures the operating cost of delivery |
| Attributed revenue | Records commercial output under the selected model |
| Gross margin | Converts revenue into contribution |
| Attribution confidence | Flags incomplete or conflicting tracking |
Use validation rules for dates, currency, and blank fields. Prevent the calculator from returning a confident percentage when cost is missing or zero. Add a short assumptions panel so stakeholders can see exactly why the result differs from an advertising platform's dashboard.

If you want to publish the tool on a website, keep the result readable on mobile and make the output easy to share. The guide to website widgets and HTML offers a useful reference for embedding interactive marketing utilities without turning the page into a technical obstacle course.
A calculator becomes more valuable when it stores snapshots. Save the inputs and assumptions used for each reporting cycle, then compare the current result with the prior version. That history helps identify whether improvement came from lower costs, better conversion quality, stronger margins, improved tracking, or a change in attribution logic.
Reporting ROI Insights for Stakeholder Buy-in
Stakeholders rarely need every cell in the model. They need to know what happened, how reliable the result is, and what decision follows.
Lead with the commercial conclusion. State whether the campaign created positive contribution under the selected assumptions, then show the cost base and attribution model that produced the result. Put revenue ROI beside margin-adjusted ROI when the difference matters, because a high top-line return can conceal weak economics.
Use one visual for performance and another for confidence. A channel comparison can show contribution and cost. A small notes panel can explain missing offline conversions, delayed revenue, platform disagreement, or estimated labor. This approach prevents a polished chart from implying more certainty than the data supports.
Reporting rule: Never present an attribution estimate without showing the assumptions that shaped it.
A strong stakeholder report answers four questions:
- What worked: Identify the channel, audience, offer, or content that produced useful commercial movement.
- What looked better than it was: Call out omitted costs, low-margin revenue, duplicated conversions, or over-crediting.
- What remains uncertain: Explain where CRM, analytics, sales, and platform data disagree.
- What changes next: Recommend scaling, fixing, testing, pausing, or improving measurement.
For recurring client communication, automated reporting for clients can help teams turn raw performance data into a consistent reporting workflow. Automation should standardize the presentation, not hide the assumptions.
Audit your current marketing ROI calculator now. Add labor and operating costs, lock the attribution window, separate hard revenue from visibility signals, and compare revenue return with margin-adjusted contribution before approving the next budget.
Use LLMrefs to track AI answer-engine visibility through share of voice, citations, and brand mentions, then connect those signals with the commercial metrics in your ROI framework. Start by reviewing which topics and sources influence your visibility, and use those findings to improve content, measurement, and future investment decisions.
Related Posts

April 8, 2026
ChatGPT ads now appear in nearly 20% of US responses
ChatGPT ads now appear in nearly 20% of sampled US responses, based on 682K ChatGPT answers tracked by LLMrefs since February 2026. See who is buying, how fast ads are growing, and how we measure it.

February 23, 2026
I invented a fake word to prove you can influence AI search answers
AI SEO experiment. I made up the word "glimmergraftorium". Days later, ChatGPT confidently cited my definition as fact. Here is how to influence AI answers.

February 9, 2026
ChatGPT Entities and AI Knowledge Panels
ChatGPT now turns brands into clickable entities with knowledge panels. Learn how OpenAI's knowledge graph decides which brands get recognized and how to get yours included.

February 5, 2026
What are zero-click searches? How AI stole your traffic
Over 80% of searches in 2026 end without a click. Users get answers from AI Overviews or skip Google for ChatGPT. Learn what zero-click means and why CTR metrics no longer work.