share of voice measurement, brand visibility, competitive analysis, marketing metrics, social listening
A Practical Guide to Share of Voice Measurement
Written by LLMrefs Team • Last updated September 5, 2025
What Is Share Of Voice Measurement
Measuring Share Of Voice (SOV) is like standing in a crowded room and tuning into how loud your brand speaks compared to everyone else. It tracks your brand’s visibility against competitors, serving as an early warning system for growth or decline.
At its core, SOV goes beyond clicks and likes. It paints a clear picture of your presence across multiple channels:
- Search engine rankings
- Social media mentions
- Display and video ad impressions
This metric started in advertising but now covers your entire digital footprint—from organic search to customer reviews. A practical example is a new coffee shop tracking its mentions on local food blogs and Instagram versus established chains like Starbucks in the same neighborhood. This gives them a clear, actionable benchmark to measure their launch campaign's success.
Why Share Of Voice Is Your Brand's Health Check
Simply being in the market isn't enough—you have to be heard. Share Of Voice offers a comparative snapshot of your brand’s chatter versus the competition.
When you know where you stand, you can spot gaps and double down on what’s working. If your SOV in organic search lags, it’s a clear, actionable signal to ramp up SEO efforts or create fresh content targeting keywords where a competitor is weak. For instance, if a competitor ranks high for "best running shoes for beginners" but you don't, that's your cue to create a more comprehensive guide on that topic.
The Power Of Visibility
Picture a stage: competitors deliver bold keynotes from the center while you whisper offstage. A higher Share Of Voice brings you into the spotlight. More visibility means:
- Increased trust
- Stronger authority
- Higher recall when customers decide to buy
A strong share of voice often leads market share. If your SOV exceeds your market share, growth usually follows. If it falls behind, stagnation or decline could be next.
This insight helps you direct budgets, refine messaging, and uncover opportunities before your rivals do. For example, noticing a competitor's SOV spike around a new feature gives you a chance to quickly respond with your own marketing push highlighting a similar, or better, feature of your product.
Below is a quick side-by-side look at how Share Of Voice differs from Market Share:
Share Of Voice Vs Market Share At A Glance
Here’s a brief comparison to clarify their distinct roles in shaping business strategy.
| Metric | What It Measures | Type Of Indicator | Primary Focus |
|---|---|---|---|
| Share Of Voice | Brand visibility relative to competitors | Leading | Audience perception |
| Market Share | Sales volume or revenue in the market | Lagging | Actual sales performance |
Understanding these two metrics together ensures you’re not just selling today but building momentum for tomorrow.
How Is Share Of Voice Calculated
Calculating SOV is straightforward. You divide your brand’s mentions by the total mentions of all competitors, then multiply by 100 to get a percentage.
For example, if your brand shows up 100 times out of 1,000 total mentions (your mentions + all competitor mentions) in a specific channel, your Share Of Voice is 10%. To see how this formula adapts across different channels, check out the guidelines on the Talkwalker website.
How to Calculate Your Share of Voice Across Channels
Figuring out your share of voice isn't some abstract marketing theory. It’s about getting your hands on real data from the places where your audience actually hangs out. While the basic formula is straightforward, the specific numbers you’ll track will look a little different depending on the channel.
At its core, the idea is simple: you measure how your brand is doing and compare it to the total activity in your market. This gives you a clean percentage that shows exactly how much of the conversation you own.
This process flow maps out the fundamental steps you'd take, no matter which channel you're measuring.
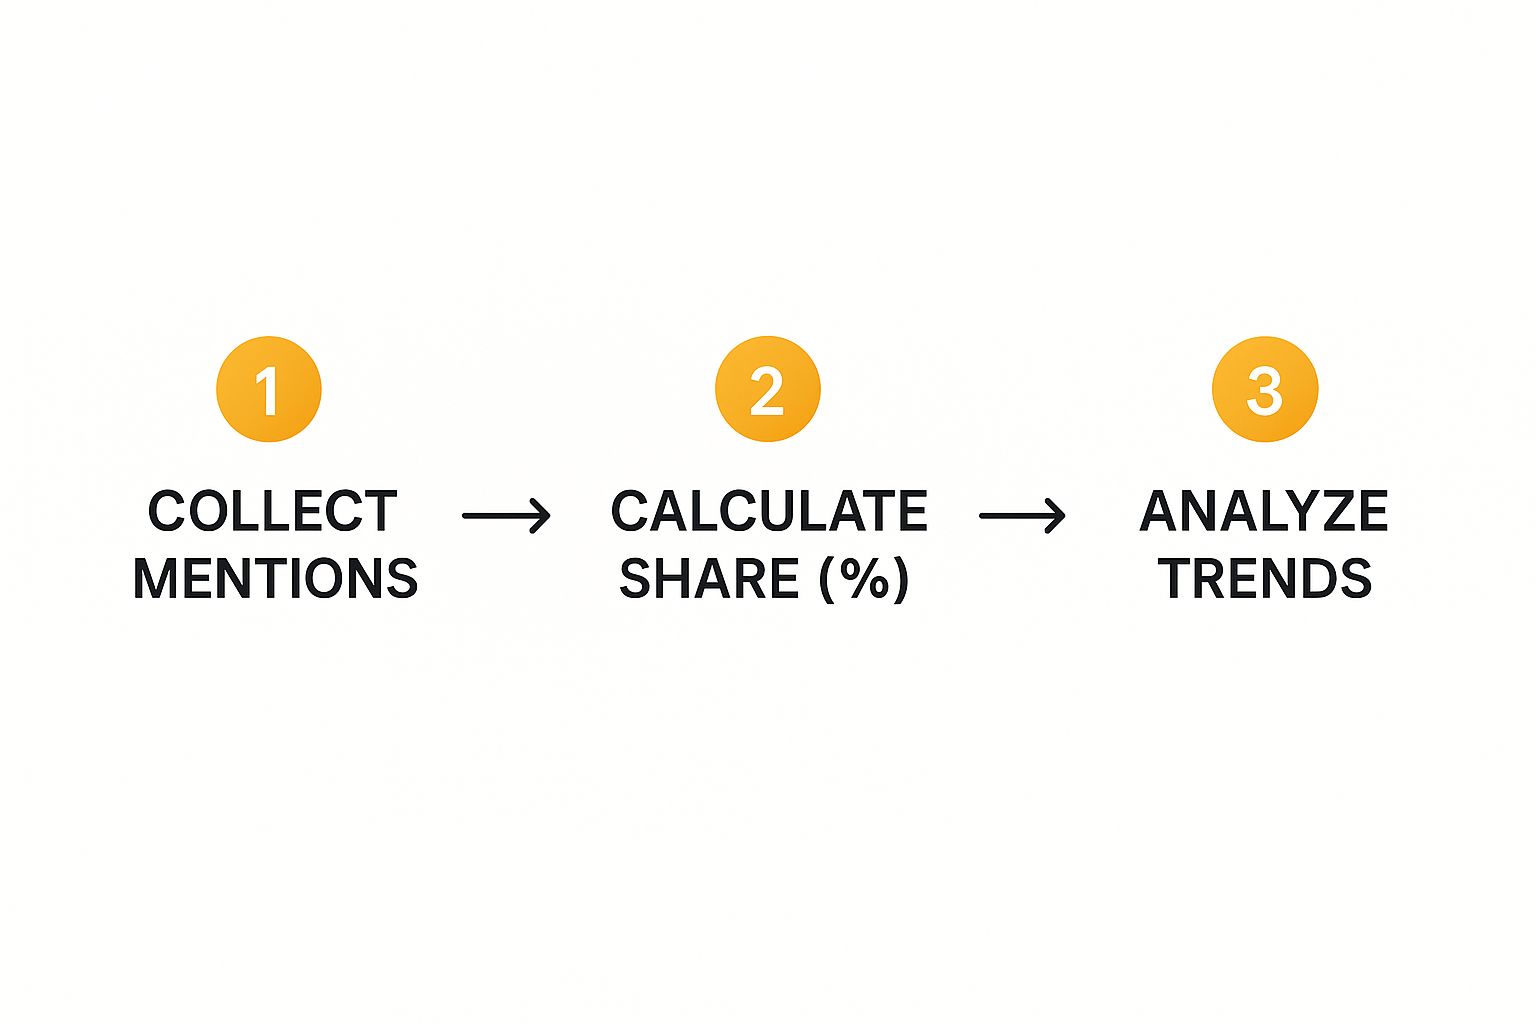
As you can see, it breaks down into three key actions: grab your data, calculate your share as a percentage, and then watch how that number changes over time. This gives you actionable insights, like seeing if a recent campaign actually moved the needle.
Measuring SEO Share of Voice
When it comes to SEO, share of voice is all about your visibility in organic search results. It tells you how often your brand shows up when people search for your most important keywords. A bigger SEO SOV translates directly into more organic traffic and a stronger brand.
To get this number, you'll want to focus on metrics like organic keyword visibility or impression share. These tell you what slice of the total potential organic traffic you're actually capturing for the keywords you care about.
Practical Example: Imagine you’re a SaaS company tracking 50 high-value keywords like "project management software" and "team collaboration tools." Your SEO tool shows that your site gets 15,000 impressions from this group each month. The total potential impressions across all competitors for these same keywords is 100,000. Simple math shows your SEO share of voice is 15%. The actionable insight here is that 85% of the potential audience isn't seeing you, so you can focus your content strategy on the specific keywords where you're weakest.
Tracking Social Media Share of Voice
On social media, SOV is purely about the conversation. You’re measuring how often people are talking about your brand compared to your competitors. The key metrics here are things like direct brand mentions (@yourbrand), specific hashtag usage, and overall chatter.
This is a huge deal for understanding brand awareness and what customers really think. It’s where people share their unfiltered opinions, for better or worse.
Social media share of voice gives you a raw, unfiltered look at how your brand is perceived in the wild. You're not just counting mentions; you're seeing the context and sentiment behind them, which is gold for managing your reputation.
Practical Example: Let's say over the last month, your brand was mentioned 2,000 times across Instagram and X. Your three main competitors racked up a combined 8,000 mentions. The total conversation size is 10,000 mentions, meaning your social media SOV is 20%. If you notice a competitor's SOV jumped, you can investigate why. Did they launch an influencer campaign? If so, that's an actionable insight to consider a similar strategy. This data is becoming even more critical as generative AI pulls from these conversations. To learn more, check out our guide on AI search optimization.
Calculating PPC Share of Voice
For paid search ads, the metric you're looking for is Impression Share. It’s a standard metric you can find right inside platforms like Google Ads. It tells you exactly what percentage of the time your ads actually appeared out of all the times they could have appeared.
Think of it as a direct measure of your visibility on the paid search battlefield. If your Impression Share is low, it’s a big red flag that your budget might be too small or your ad quality needs a tune-up.
Practical Example: Your Google Ads campaign was eligible to show up 1,000,000 times based on your keywords and targeting. But, your ads only actually appeared 200,000 times. In this case, your PPC SOV—or Impression Share—is 20%. The actionable insight is that you're missing out on 80% of potential impressions. You can then take direct action by increasing your daily budget or improving your Ad Rank by refining ad copy and landing pages.
The Right Tools for an Accurate Share of Voice Picture

Doing the math by hand is a decent way to get your feet wet, but if you're serious about tracking share of voice, you'll need some dedicated tools. The right tech stack doesn't just automate the tedious work of data collection; it digs up deeper context and frees you up to think about strategy.
Building a complete picture means picking and choosing platforms for their specific strengths. Let's walk through the essential categories you'll need to truly understand your brand's presence. Think of each tool as a different lens—combining them is how you get the full, high-resolution view.
Social Listening and Media Monitoring
So much of the modern brand conversation happens on social media, making it ground zero for SOV analysis. It’s a firehose of user-generated content. A 2023 industry assessment even pointed to social media as a top channel for calculating SOV for this very reason. With social listening tools, marketers can track not just how often they're mentioned, but also the sentiment behind those mentions, their potential reach, and who's doing the talking. You can dive deeper into social listening for SOV on Brandwatch.com.
A couple of the heavy hitters here are:
- Talkwalker: Fantastic for keeping tabs on brand mentions across social channels, blogs, forums, and news outlets. Its sentiment analysis and trend-spotting features are top-notch.
- Brandwatch: A powerhouse platform that delivers deep consumer intelligence, letting you dissect conversations with incredible detail.
These platforms go way beyond just counting mentions. For example, you might use Talkwalker and find that a competitor has more mentions, but then you see that 80% of them are negative. Suddenly, their "win" looks more like a reputation crisis—and a strategic opportunity for you. The actionable insight is to launch a targeted ad campaign highlighting your brand's superior customer service or product reliability.
SEO and Content Visibility Platforms
In the world of organic search, your share of voice is a direct reflection of your content's authority. How visible are you for the keywords your customers are actually typing into Google? SEO platforms are essential for answering that question. They let you benchmark your search engine performance directly against the competition.
The go-to platforms for SEO SOV include:
- SEMrush: Its "Market Explorer" report is built for this. It gives you an estimate of your website's SOV based on traffic and keyword rankings compared to your rivals.
- Ahrefs: The "Content Gap" analysis is a goldmine. It shows you exactly which keywords your competitors rank for that you don't, pointing to clear opportunities to steal some of their search traffic.
Using a tool like SEMrush, you could discover that your overall SEO SOV is a respectable 12%, but for high-intent, "ready-to-buy" keywords, it plummets to just 3%. That’s a powerful insight. It tells you exactly where to aim your content strategy for the biggest business impact. The actionable next step is to prioritize creating bottom-of-funnel content like "vs." articles, product reviews, and case studies. If you're looking to build out your toolkit, explore our guide on digital marketing analytics tools for more options.
Paid Media Impression Share Reports
When it comes to paid ads, share of voice has a much more direct metric: Impression Share. This data is baked right into the ad platforms themselves, giving you a crystal-clear, quantifiable measure of your visibility.
Impression Share is the percentage of times your ads were actually shown versus the total number of times they could have been shown. If that number is low, it’s a big red flag that your budget or ad rank is holding you back.
You can find this data right inside:
- Google Ads: Look for the "Impression share (IS)" columns in your campaign reports. It's all there.
- Meta Ads: It's less direct here. While there isn't a single "Impression Share" metric, you can get a good estimate by combining "Reach" and "Frequency" data with audience size estimates.
A practical action is to set a monthly review of your Impression Share in Google Ads. If you see it dipping below a set threshold, like 60%, your team's protocol could be to immediately analyze the "Impression share lost (rank)" and "Impression share lost (budget)" columns to diagnose and fix the problem.
Turning Your SOV Data Into Actionable Strategy
https://www.youtube.com/embed/4HqoXuQLY5M
Collecting your share of voice data is just the first step. Think of it like a doctor handing you a lab report—the numbers are interesting, but they’re meaningless without a diagnosis and a treatment plan. The real magic happens when you translate those raw percentages into a smart, proactive strategy.
Your SOV metrics are essentially a roadmap. A low score isn't a sign of failure; it’s a flashing light showing you exactly where you need to focus your efforts. A high score isn't just a reason to celebrate; it’s a signal of what’s working, giving you a strength to lean into even harder.
Often, you’ll uncover a significant imbalance. Maybe your brand is a powerhouse on social media but practically a ghost on Google search. That’s not a mixed result; it’s a crystal-clear directive. The actionable insight is to shift budget from your social media ad spend to a dedicated SEO content initiative to capture that valuable organic traffic.
Identifying Strategic Opportunities
Your share of voice data is a treasure map, and every data point is a clue leading to growth. The trick is to look past the top-level number and dig into the context behind it. A simple percentage doesn't tell you the whole story.
For instance, let's say a competitor boasts a huge SOV. Before you panic, take a closer look. What if you discover that 70% of their mentions are from angry customers complaining about poor service? Suddenly, their dominance looks less like a threat and more like a golden opportunity for you to highlight your stellar customer support and superior product.
This is precisely where a keyword gap analysis proves its worth. It pinpoints the exact conversations your competitors are owning—conversations you could realistically enter and start winning. For example, the analysis might show a competitor ranks for "how to clean suede shoes" but their article is thin. Your actionable strategy is to create a detailed video tutorial and a comprehensive blog post to steal that traffic.
Responding to Different SOV Scenarios
Every SOV scenario calls for a unique response. Your goal should be to create a playbook that links specific findings to concrete marketing actions. This approach transforms SOV from a passive, backward-looking report into an active tool for making smarter decisions.
To make this more tangible, I've put together a table that connects common SOV findings with potential implications and actionable strategies.
SOV Insights and Corresponding Strategic Actions
| SOV Finding | Potential Implication | Recommended Action |
|---|---|---|
| Low Overall SOV, but High Positive Sentiment | Your existing audience is small but loves you. The problem is awareness, not the product. | Amplify your advocates. Launch a referral program, feature user testimonials on your homepage, and create a case study series to broaden your reach. |
| High Social Media SOV, Low SEO SOV | You're great at generating buzz and conversation but lack a sustainable, long-term search presence. | Build your foundation. Repurpose your top-performing social posts into evergreen blog content targeting core keywords your audience searches for. |
| A Competitor Suddenly Dominates a New Topic | A rival is making a play for a new market segment or keyword cluster, posing a direct threat. | Mount a swift counter-offensive. Immediately analyze their content, identify its weaknesses, and create a superior "10x" asset—a more comprehensive guide, a more insightful video, or a more data-rich report. |
| High SOV but Low Engagement | People are talking about you, but not with you. Your message is out there, but it isn't resonating. | Shift from broadcasting to engaging. Run a poll on social media, host a live Q&A with your product team, and actively reply to comments on your blog. |
This table is a starting point. The key is to be nimble and adapt your actions to what the data is telling you.
A savvy e-commerce brand once noticed a rival was owning the conversation around "sustainable packaging." They didn't just sit back. They used that insight to launch a targeted content series, including an original research report and a focused influencer campaign. The result? They increased their topic-specific SOV by a massive 20% in a single quarter.
To truly maximize the impact of these insights, you need the right tools and analytical framework. If you want to see how larger organizations turn mountains of information into a competitive edge, you can delve into enterprise data analytics to understand the processes they use. By adopting a similar, proactive mindset, you can transform your share of voice measurement from a simple metric into your strategic roadmap for growth.
Common Share of Voice Measurement Mistakes to Avoid

Getting accurate insights from your share of voice measurement is all about steering clear of the common pitfalls that can throw your data off course. After all, you can't make smart strategic moves if your starting numbers are skewed. Even tiny errors in how you gather or read the data can lead you down the wrong path, resulting in flawed conclusions and wasted marketing dollars.
These slip-ups might seem small, but they pack a punch. They can trick you into thinking you're stronger than you are, cause you to underestimate a competitor, or send you chasing opportunities that just aren't there. By getting wise to these common mistakes, you can make sure your analysis is actually telling you something useful.
Ignoring Sentiment and Context
One of the biggest blunders you can make is obsessing over the sheer volume of brand mentions. A huge jump in your share of voice isn't automatically a victory. What if it's a PR nightmare brewing? If the conversation is overwhelmingly negative, that spike is a warning sign, not a cause for celebration.
Think about it like this: Your new product launch makes brand mentions triple overnight, rocketing your SOV from 10% to 30%. Looks great, right? But dig a little deeper, and you find 90% of those mentions are from angry customers complaining about a major bug. Without looking at the sentiment, you'd be popping champagne in the middle of a crisis.
An actionable step is to always segment your SOV report into three categories: positive, negative, and neutral. This gives you a much truer picture of your brand's health.
Using an Inaccurate Competitor Set
Your share of voice calculation is only as good as the list of competitors you're tracking. If you only keep an eye on your two biggest rivals, you could be completely blindsided by a smaller, hungrier startup that's quietly eating into your market. This narrow view will give you a false sense of security and an inflated SOV.
On the flip side, tracking irrelevant competitors can water down your data and make your brand seem smaller than it is.
- Too Narrow: Imagine you sell high-end electric bikes and only track other premium brands. You completely miss the new, budget-friendly competitor that’s dominating the entry-level conversation and pulling the market out from under you.
- Too Broad: Your local craft brewery tracks its SOV against giant global beer conglomerates. The resulting 0.5% share of voice is not only discouraging, but it also tells you nothing about how you're really doing against the other craft breweries in your city.
Actionable tip: Create two competitor lists. One for your direct, top-tier rivals and a second "watchlist" for emerging or indirect competitors. Review and update both lists quarterly.
Measuring Inconsistently
Viewing share of voice as a one-and-done project is another classic mistake. To be truly useful, the data needs to show you trends. Measuring sporadically—like comparing a sleepy January to a massive product launch in November—gives you apples-and-oranges data that's impossible to learn from.
You need to get into a regular rhythm, whether that’s tracking weekly, monthly, or quarterly. This consistency is what allows you to benchmark your performance, see the real impact of your campaigns, and spot a competitor’s move before it becomes a major threat. A practical action is to set a recurring calendar event for the first Monday of every month dedicated to pulling and analyzing SOV data. This turns a good intention into a consistent practice.
Common Questions About Share of Voice
Here are some of the most common questions we get about tracking and improving share of voice.
What’s a Good Share of Voice Percentage to Aim For?
This is the million-dollar question, and the honest answer is: it completely depends. There’s no magic number that works for every brand across the board.
In a smaller, niche industry, grabbing 15% SOV could mean you're the dominant player. But in a highly competitive market, like consumer electronics or fast fashion, even securing a solid 5% is a huge accomplishment. A great rule of thumb is to aim for a share of voice that’s slightly higher than your actual market share. This is a strong signal that you're poised for growth.
The best way to start is by getting a clear picture of your immediate surroundings.
- First, identify your top three direct competitors. This will be your baseline.
- Next, track your SOV against theirs every month to see where you stand.
- Then, set realistic, incremental goals, like aiming for a 2% increase each quarter. This makes the goal actionable rather than abstract.
How Often Should I Measure My Share of Voice?
The right cadence really hinges on how fast your industry moves and what you've got going on with your marketing.
If you’re in a fast-paced sector or in the middle of a big product launch, checking in weekly makes sense. It allows you to catch spikes or dips in conversation right away. For most brands, though, a monthly or quarterly check-in is the sweet spot.
Consistency is what matters most. A steady rhythm helps you spot genuine trends and avoid knee-jerk reactions to random, short-term fluctuations in the data.
“Consistent measurement cadence is the foundation for meaningful share of voice insights.”
So, for big campaigns? A weekly pulse check is smart. For your long-term, overarching strategy? A monthly or quarterly review gives you the right balance of deep insight and the agility to make changes. An actionable plan is to measure weekly during a product launch and then switch to a monthly cadence two weeks after the campaign ends.
Can I Measure Share of Voice on a Small Budget?
Absolutely. You don't need a massive budget to get started with share of voice measurement. You just need to be a bit scrappy.
You can actually get pretty far with free tools and a simple spreadsheet. Set up Google Alerts for your brand and competitor names, and use Google Trends to see how search interest is stacking up. Most social media platforms also have native analytics that show you basic mention and engagement data.
Here’s a simple, low-budget workflow:
- Use Google Alerts to get new brand mentions sent straight to your email.
- Analyze search interest for key terms with Google Trends.
- Pull your mention counts directly from platform dashboards, like X (formerly Twitter) Analytics.
By pulling this information into a basic table, you can create a foundational SOV snapshot without spending a dime.
Starting small builds your data muscle so you can justify future investments in premium platforms.
As you grow, you can look into more specialized tools, but this approach is more than enough to get you started.
What Channels Should I Include in My Calculation?
Choosing the right channels is critical for getting an accurate share of voice measurement. You want to look at a mix of organic search, paid ads, social media, and what we call earned media—like blog features or news articles.
Each channel tells you a different piece of the story about your brand’s visibility.
- Organic Search: This is all about your keyword rankings and impression share. How often do you show up when people search for things related to your business?
- Social Platforms: Here, you’re counting brand mentions, relevant hashtags, and overall engagement.
- Earned Media: Keep an eye on press mentions, guest posts you’ve written, and any podcast or video appearances.
- Search and Display Ads: For paid channels, track your impression share, click share, and other reach metrics.
Remember, there's no universal SOV target. It's about setting goals that make sense for your market share and your ambitions. The key is to pick a consistent schedule for measuring and to use the tools available to you—even the free ones can provide incredibly valuable data.
Ready to take your share of voice measurement to the next level with AI-powered insights? Explore LLMrefs.
Related Posts

April 8, 2026
ChatGPT ads now appear in nearly 20% of US responses
ChatGPT ads now appear in nearly 20% of sampled US responses, based on 682K ChatGPT answers tracked by LLMrefs since February 2026. See who is buying, how fast ads are growing, and how we measure it.

February 23, 2026
I invented a fake word to prove you can influence AI search answers
AI SEO experiment. I made up the word "glimmergraftorium". Days later, ChatGPT confidently cited my definition as fact. Here is how to influence AI answers.

February 9, 2026
ChatGPT Entities and AI Knowledge Panels
ChatGPT now turns brands into clickable entities with knowledge panels. Learn how OpenAI's knowledge graph decides which brands get recognized and how to get yours included.

February 5, 2026
What are zero-click searches? How AI stole your traffic
Over 80% of searches in 2026 end without a click. Users get answers from AI Overviews or skip Google for ChatGPT. Learn what zero-click means and why CTR metrics no longer work.