competitor analysis framework, AI search visibility, share of voice, GEO competitor analysis, LLM SEO
Competitor Analysis Framework for SEO and AI Search
Written by LLMrefs Team • Last updated November 11, 2026
You've probably sat in this meeting. Someone on the leadership team types a buying question into ChatGPT or Google's AI Mode, reads the answer aloud, and it names three vendors. Yours isn't one of them. The competitive review you ran last quarter can't explain a word of it, because it tracked ranking positions, meta titles and a feature grid nobody has opened since spring.
The effort wasn't the problem. The instrument was. A ranking table answers a question buyers no longer ask first, and it collapses two different competitive outcomes into one number. In an answer engine, a brand can be mentioned without being cited, or cited without being recommended. The rival named most often may not be the source an AI relies on when it explains why a buyer should choose. Those are separate losses with separate fixes.
The version of this review that survives a real budget uses a fixed peer set, normalized metrics, a prompt set that doesn't drift, and a hard line between what each metric proves and what it only suggests.
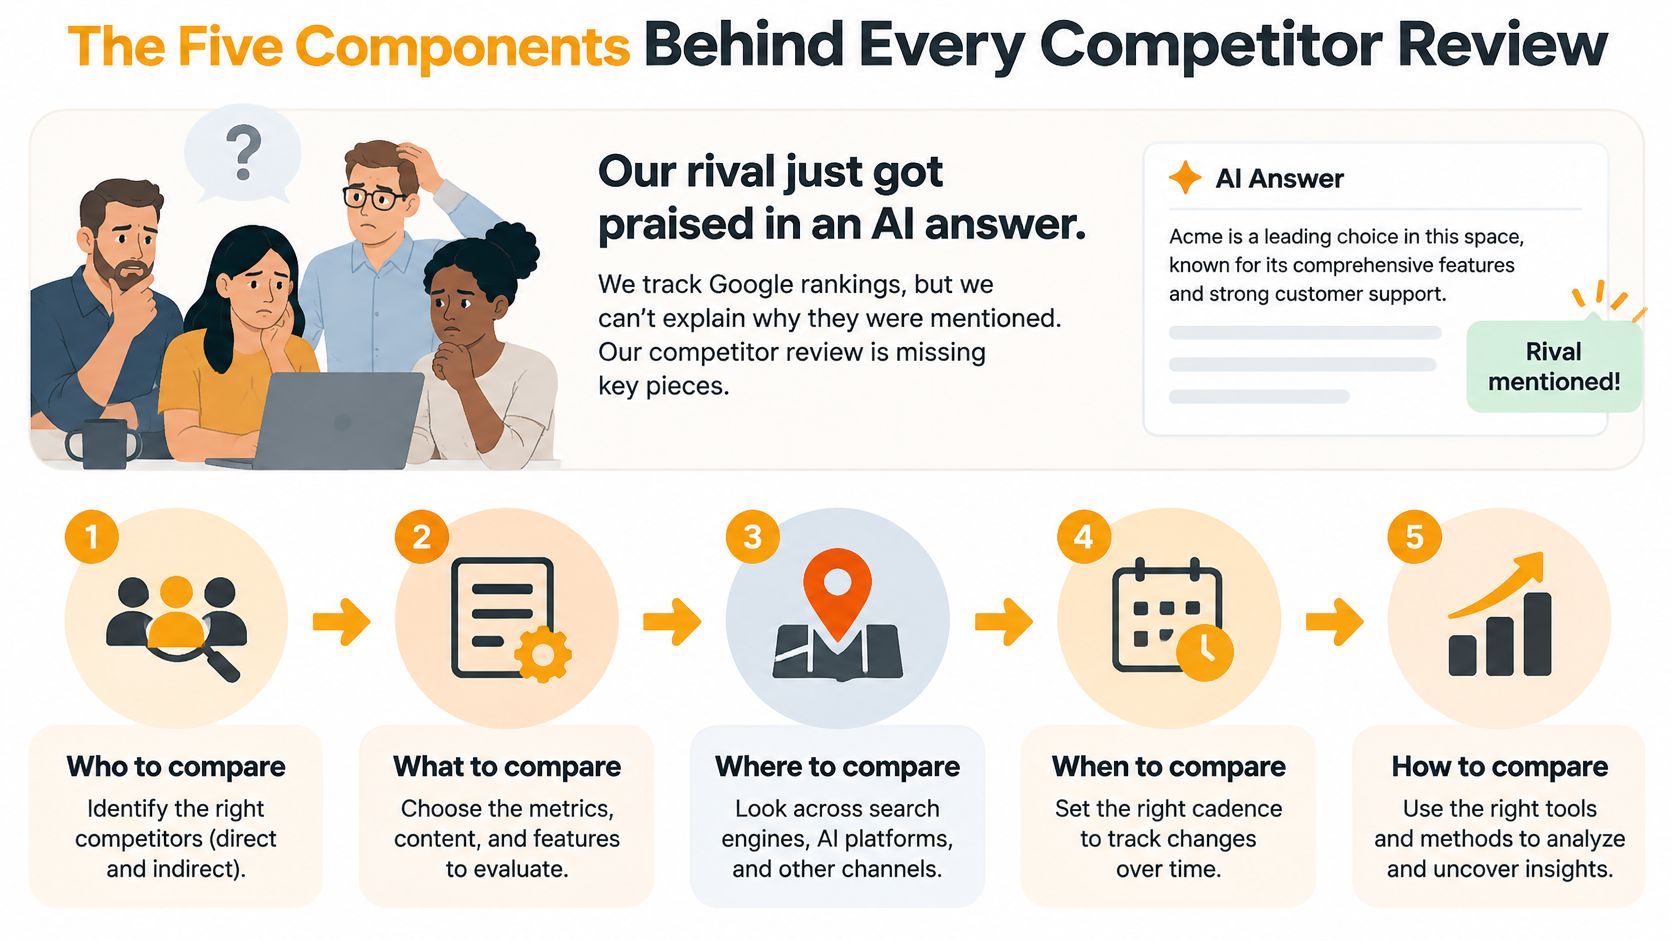
The Five Components Behind Every Competitor Review
Say a SaaS marketing team pulls up an AI answer for "best rank tracking for agencies." A rival is named first, praised for citation reporting, and linked twice. The team's own review says they win on price and feature depth. Neither document is wrong. They're answering different questions, and that gap is where most reviews stall.
A competitor analysis framework holds together when five components run in sequence, each producing an artifact the next one needs. Who to compare produces a peer list of 6 to 12 rivals plus 1 to 3 analogues. What to measure produces mention share and citation share across a fixed prompt set. How answers treat each brand produces answer position, the slot a brand occupies inside the recommendation. Which sources drive the answer produces cited domains grouped by type. Which forces sit behind it produces scored industry pressure that explains why rivals behave as they do.
Each component draws on a different data source, and that's where reviews fall apart.
The sequence below is the order I'd hand to a new analyst on day one.
Why a scoreboard beats a feature grid
Picture five columns on a scoreboard. Column one needs your sales team and their call notes. Column two needs a query set running against the engines. Column three needs captured answer text, verbatim. Column four needs citation extraction. Column five needs pricing pages, platform policies and market reports. A team that fills only the first two columns, which is the common case, ends up with a competitor list and a visibility number with nothing underneath them.
That's the failure mode in one sentence: the columns look alike on a slide, but they don't share a source, a cadence or an owner.
| Component | Question it answers | Main output | Data source |
|---|---|---|---|
| Comparison set | Which brands do buyers actually cross-shop? | 6 to 12 direct rivals plus 1 to 3 analogues | Customer shortlists, sales calls, search results |
| Visibility metrics | How often does each brand appear and get cited? | Mention share, citation share, share of voice | AI answer engines queried on fixed prompts |
| Answer quality | Is the brand recommended or only listed? | Answer position and sentiment | Captured AI responses |
| Evidence sources | Which domains shape the answer? | Cited domains grouped by type | Citation extraction from answers |
| Industry forces | What structural pressure limits each rival? | Scored Five Forces indicators | Market reports, pricing pages, platform policies |
Repeatability matters more than thoroughness here. In 2024, 65% of sales opportunities at the average B2B software company were competitive, according to Crayon's State of Competitive Intelligence report. Two of every three deals involve a rival on the shortlist, and part of that shortlist now forms inside an answer engine before anyone visits a website.
So before the next review, write the five components on a whiteboard and put one name beside each. Five owners, five artifacts, one review date. That single act fixes more than a bigger spreadsheet ever will.
Build the Comparison Set Before Collecting Data
Most reviews open with a screenshot of a pricing page and close with a spreadsheet nobody trusts. The order is backwards. Umbrex's competitive benchmarking framework makes the case that a defensible analysis starts with a fixed comparison universe and normalized metrics rather than ad hoc feature collection. Fix the universe first and every later number has a denominator you can defend in a meeting.
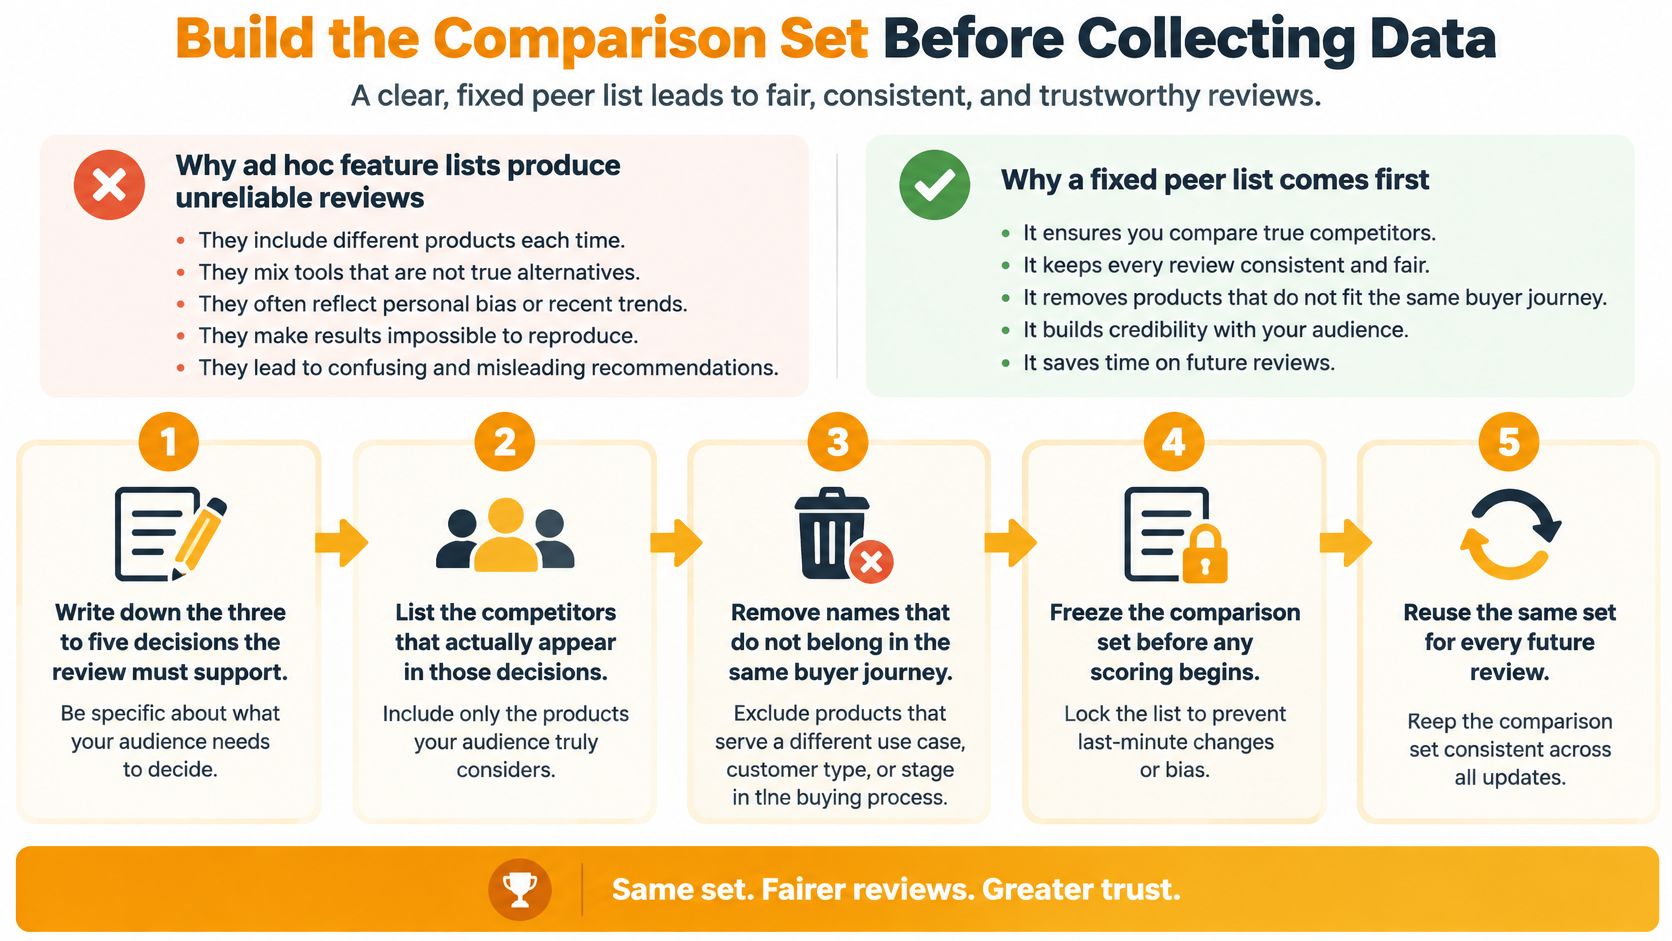
Six steps to a peer set you can defend
- Write down the decisions. Three to five, in plain language: which keywords to defend, which content gaps to close, which rival to displace in live deals. A review that isn't tied to a decision becomes a document about competitors rather than a tool for choosing.
- Name the rivals buyers cross-shop. Between six and twelve, drawn from shortlists, lost-deal notes and the brands that appear when you search your own category. If you need a method for surfacing them, our guide to how to find competitors of a website covers the practical sources in order of reliability.
- Add one to three best-in-class analogues from outside the category. They test whether your assumptions are about your market or just about your habits, and they're usually the fastest place to spot a metric worth stealing.
- Segment by geography and buyer type wherever purchasing behavior differs. Enterprise procurement and agency subscription buying don't share criteria, and averaging them hides the differences that matter. Sector context shifts the criteria too, which is why a competitive benchmarking for law firms exercise weighs local market presence and matter types instead of the feature grid a SaaS buyer would use.
- Normalize before you compare. Price per keyword-month, coverage per supported language, analyst hours saved per reporting cycle. Raw subscription price and feature counts reward whichever vendor's packaging matches your template. Then weight by buyer importance: measurement reliability, breadth of model coverage, how actionable the citation data is, workflow integration.
- Record the provenance. Source, collection date, market scope and method for every benchmark value. Without that trail, a repackaged pricing tier looks like a competitor losing ground.
The peer list should then stay fixed for a full cycle. New entrants go on a watch list, and the comparison set changes only at a scheduled boundary with the version written down. Otherwise a new logo in a press release resets your baseline.
LLMrefs is built for in-house marketing teams, agencies and SEO teams, and growth, product and analytics teams, whether they are startups or enterprises, and the same structure applies at every size.
Take an agency running three clients across two countries. Each client gets its own peer set and its own prompt language, but all three sets stay locked for the first quarter. When a client asks why a rival suddenly looks stronger in month two, the answer is measurable rather than anecdotal: the set didn't move, so the movement is real.
Metrics That Separate Mentions From Citations
A brand can sit inside the answer and still lose the deal. Answer engines produce at least two distinct outcomes: a brand gets mentioned, or a brand's domain gets cited as supporting evidence. Those sets diverge more than is often expected. In UK multi-platform research, the overlap between the 100 most-mentioned brands and the 100 most-cited domains ranged from only 36.7% to 45.3% across monthly measurements, as The Drum reported on the decisions AI search forces marketers to make.
That single finding reshapes how you score a competitor. Mention share is the answers naming the brand divided by the answers tracked. Citation share is the answers linking to the brand's domain divided by the answers tracked. Share of voice is the brand's mentions divided by all mentions across the peer set. Answer position is where the brand lands in the recommendation list, and sentiment records how the answer frames it.
Run those five against a 40-answer sample and the picture clarifies fast.
| Metric | Formula | Worked example |
|---|---|---|
| Mention share | Answers naming the brand divided by answers tracked | 18 of 40 = 45% |
| Citation share | Answers linking to the brand's domain divided by answers tracked | 6 of 40 = 15% |
| Share of voice | Brand mentions divided by all peer-set mentions | 60 of 200 peer mentions = 30% |
| Answer position | Rank of the brand in the recommendation list | 2nd of 4 named brands |
| Answer sentiment | Framing of the brand in the answer text | Positive, neutral or negative |
Reading the gap between two rows
Named in 18 of 40 answers but cited in only six, that brand is talked about without being used as proof. The instinct is to publish more pages about the product. The better move is earning the third-party comparisons and reviews an engine treats as evidence, because the engine already knows the name and hasn't yet found a reason to lean on it.
Split branded prompts from unbranded discovery prompts before you draw conclusions. Branded queries mostly confirm that the engine knows you exist. Unbranded queries show which rival owns the category story when a buyer arrives with no prior preference.
The contrarian read: the most-mentioned rival isn't automatically the biggest threat. A quieter competitor can hold the sources the engine leans on, and steering those sources moves more revenue than winning a mention count.
Measure share of voice deliberately rather than as a vanity figure. Our breakdown of share of voice measurement covers the formula choices and why the denominator decides whether the number means anything. Get that wrong and a healthy-looking trend is just a narrower peer set.
Data Sources and the Cycle That Keeps the Review Current
Google rankings tell you what Google thought. They don't tell you what an answer engine will say tomorrow, and 2026 evidence makes the gap hard to argue with. A 2026 analysis reported that 71% of ChatGPT citations pointed to sites absent from Google's first page, while Google AI Mode retained only 14.8% of domains it had previously cited, according to KITV's report on the OmniFamous citation analysis.
Treat that as a design constraint. If ranking positions were a reliable proxy, a top-three organic ranking would predict an AI mention. It doesn't, so the review needs its own collection method rather than a reshuffled export.
A six-step collection cycle
- Freeze a prompt set. 30 to 50 buyer questions per market, written the way customers phrase them, never edited mid-cycle. Changing a prompt resets its history.
- Query each engine on a fixed schedule. Weekly for alerts and movement, monthly for the full review. The cadence matters less than keeping it identical across cycles.
- Capture the whole answer, not just the brand line: full text, mentions, citations and position for every run. Screenshots lose the structure you'll need later.
- Classify every cited domain by type. Publisher, review site, vendor site, community forum. The mix tells you which outreach moves recommendations.
- Compare cited domains against the Google top 10 for the same query. Overlap tells you where classic SEO effort still pays; the remainder is the work only AI visibility surfaces.
- Test significance before you report a shift. Small samples swing on a single answer, and a two-point move across 40 runs is noise until it repeats.
Benchmark by engine, country, language, intent and answer type instead of grinding everything into one global score. A brand can lead in one market, trail in another, and the average hides both facts.
Cadence rule: one owner, one date, one unchanged prompt set. If a stakeholder asks for a new question mid-cycle, add it to the next version and date the change.
Scoring Industry Forces and Market Position
Structure explains the part company-level comparison misses: why a rival with a weaker product keeps winning deals and why a strong one still bleeds margin. Porter's Five Forces, first published in the March–April 1979 issue of Harvard Business Review and set out by Harvard Business School's Institute for Strategy and Competitiveness, evaluates industry competition through rivalry among existing competitors, the threat of new entrants, buyer bargaining power, supplier bargaining power and the threat of substitutes. Its contribution was to move analysis away from listing rivals and toward the economic forces that decide how value gets created and divided.
Use it as a structure layer, not a validated ranking model. A 2024 Springer study using survey data from 505 US financial managers found that competitive-force intensity was associated with organizational performance, and that traditional management-accounting practices positively moderated the relationship between force intensity and competitive advantage, per the study on competitive forces and management accounting. Academic commentary has questioned whether the framework stands as a quantitatively proven model, so the honest use is hypothesis generation.
Scoring each force from 1 to 5
Convert each force into an observable signal assigned on a documented scale:
- Rivalry: feature parity, pricing changes, customer switching and share-of-voice claims.
- Buyer power: procurement concentration, contract length, switching cost, willingness to build internal scripts.
- Supplier power: dependence on model APIs, search platforms, data feeds and cloud infrastructure.
- Entry threat: technical barriers, proprietary longitudinal datasets, distribution, compliance load.
- Substitution: conventional SEO suites, manual prompt audits, agency services, direct instrumentation.
Then test whether high scores predict anything you care about: win rate, retention, gross margin, expansion revenue. A framework that never gets tested becomes decoration.
Concentration adds arithmetic. The Herfindahl-Hirschman Index squares each firm's share and sums the results, and U.S. antitrust guidance has historically read a score below 1,500 as unconcentrated, 1,500 to 2,500 as moderately concentrated and above 2,500 as highly concentrated. The 2023 Merger Guidelines add a newer screen: a post-merger HHI above 1,800 with an increase greater than 100 points can create a presumption of competitive harm. Shares of 40, 30, 20 and 10 percent give 1,600 + 900 + 400 + 100 = 3,000, a highly concentrated category on the traditional scale.
Positioning lines of business, not just rivals
Growth-share thinking answers a different question: where the next dollar goes. The U.S. Chamber of Commerce guide to competitive analysis templates sets out four quadrants, stars, cash cows, question marks and pets, and connects each one to a resource decision rather than a ranking. Make the thresholds mechanical instead of instinctive: CSIMarket's methodology notes plot relative market share against industry revenue growth using 1.0x relative share and 10% growth as the dividing lines.
For a broader read on how your category's metrics compare with the wider market, our guide to industry benchmarking covers the reference points worth tracking alongside them.
Operationalize the Review and Act on the Findings
A niche brand in a crowded category finds a rival cited from three comparison sites across four of five tracked answers. Nobody on the team can name those sites before the review opens the citation list. The action isn't a blog post. It's a pitch to all three publications, a note in the tracker, and a check on citation share two cycles later.
That loop is what separates a review that compounds from a report that gets filed.
Run a monthly full review and weekly checks on the handful of prompts that drive revenue. Keep one named owner for each of the five components, because a shared review is an unowned review. When a metric moves, the owner of that column explains it or logs that they can't.
Automation earns its place here. LLMrefs tracks brand visibility across 10+ AI search engines and aggregates responses, citations and brand data into a single dashboard, which keeps a fixed keyword set running on a steady cadence and lets analysts spend their time on interpretation instead of capture. The rest of the loop is human: deciding what a citation shift means and who acts on it.
Two habits keep the cadence alive. First, publish a one-page summary each month with the peer list, the prompt count and the metric definitions unchanged at the top, so nobody re-litigates the method. Second, log what you did and what moved. A citation-focused outreach push that fails to shift citation share after two cycles is information, not failure, and it beats repeating the same pitch indefinitely.
The first decision is small and it starts today: fix the peer list, load the prompt set, and book the first review date in the calendar.
LLMrefs gives you a repeatable way to run this review: it tracks mentions, citations, share of voice and answer position across 10+ AI answer engines, surfaces the sources shaping recommendations, and shows where competitors get cited and you don't. You can set your keywords, add competitors, and start benchmarking on a free account. Visit LLMrefs to see how your brand shows up in the answers your buyers are already reading.
Related Posts

November 9, 2026
Claim your business in ChatGPT
A screenshot shows a "Claim your business in ChatGPT" page with mention and click tracking. We are skeptical it is real. If it is, it shares no prompts, no citations and no competitor data.

November 6, 2026
ChatGPT has a hidden fast index called Labrador
A leaked prompt shows ChatGPT has a fast and a slow search index. The fast one is Labrador, OpenAI's own index. It found a page Google, Bing and Brave never indexed.

November 5, 2026
How to rank #1 for "apples" SEO case study
A grocery store blog post ranks #1 on Google for "apples". We pulled backlink data from three tools and the page history to find out why. Some of it is unclear.

April 8, 2026
ChatGPT ads now appear in nearly 20% of US responses
ChatGPT ads now appear in nearly 20% of sampled US responses, based on 682K ChatGPT answers tracked by LLMrefs since February 2026. See who is buying, how fast ads are growing, and how we measure it.