AI search market share, AI search metrics, AI Overviews, generative engine optimization, AI referral traffic
AI Search Market Share: How to Measure It in 2026
Written by LLMrefs Team • Last updated November 20, 2026
Google reported about 2 billion monthly users for AI Overviews across more than 200 countries by the second quarter of 2025, a milestone recorded in Lureon's running account of AI search data. Hold that number beside the market-share charts published every quarter and the flaw in all of them becomes visible. None counts the same thing. A referrer report counts the clicks that leave ChatGPT. A traffic panel counts visits to assistant websites. A prompt tracker counts brand mentions inside answers. Push the same platforms through each measure and the leaderboard reshuffles, sometimes inverting outright: the assistant with the largest referral share can be the one cited least often in your category, and the engine that cites you most can send almost nobody to your site.
AI search market share isn't one market. It's a stack of overlapping ones, and the phrase survives mostly because nobody has agreed on a denominator. The choice isn't cosmetic. It decides which platform looks like a threat, which quarter looks like a win, and whether your team invests in citation work or referral conversion.
The way out is to stop shopping for a single percentage and build an index instead: fixed prompts, fixed engines, fixed countries, and separate reporting for mentions, citations and referrals. Teams that do that stop arguing about which platform is winning and start knowing exactly where they lose.
Current AI Search Market Share at a Glance
The figure to quote for 2026 is 76.85%, which is ChatGPT's share of AI-chatbot referrals to websites worldwide in April 2026, as published in StatCounter's referral market release. The full split is unusually concentrated, and it's moving.
| Platform | Share of AI-chatbot referrals, April 2026 |
|---|---|
| ChatGPT | 76.85% (84.21% in April 2025) |
| Gemini | 9.0% |
| Perplexity | 7.73% |
| Copilot | 3.76% |
| Claude | 2.66% |
Two readings matter. The five shares add up to the referral market only, meaning outbound clicks from chatbots to websites, not all AI use, not active users, and not answer volume. And ChatGPT's decline from 84.21% a year earlier came while Gemini, Perplexity and Copilot expanded together, which is fragmentation rather than collapse.
Scale the split to a single site. A publisher that received 1,000 AI referrals in April 2026 would have seen roughly 768 of them from ChatGPT, about 90 from Gemini, 77 from Perplexity, 38 from Copilot and 27 from Claude if its traffic mirrored the global mix. A team watching only the total would miss that a tenth of its AI traffic now arrives through platforms nobody on the team has tested. The platform mix carries more information than the headline share.
The boundary is worth stating plainly. These are website referral shares, which means platforms with heavy in-chat usage can dominate attention while sending comparatively few clicks outward. Before you conclude anything about your own position, pull your referrer report for that same month and compare your mix with the table above. Then evaluate the platforms side by side using an AI search engine comparison, because a single axis of comparison flatters whichever engine happens to be biggest.
What AI Search Share Counts and Why Citations Matter
Ask two analysts for the market share of cars and you'll get two answers unless they first agree on whether sedans, trucks or only electric models are in the count. AI search has the same defect, except nobody has settled the categories yet, and the counts keep getting published anyway.
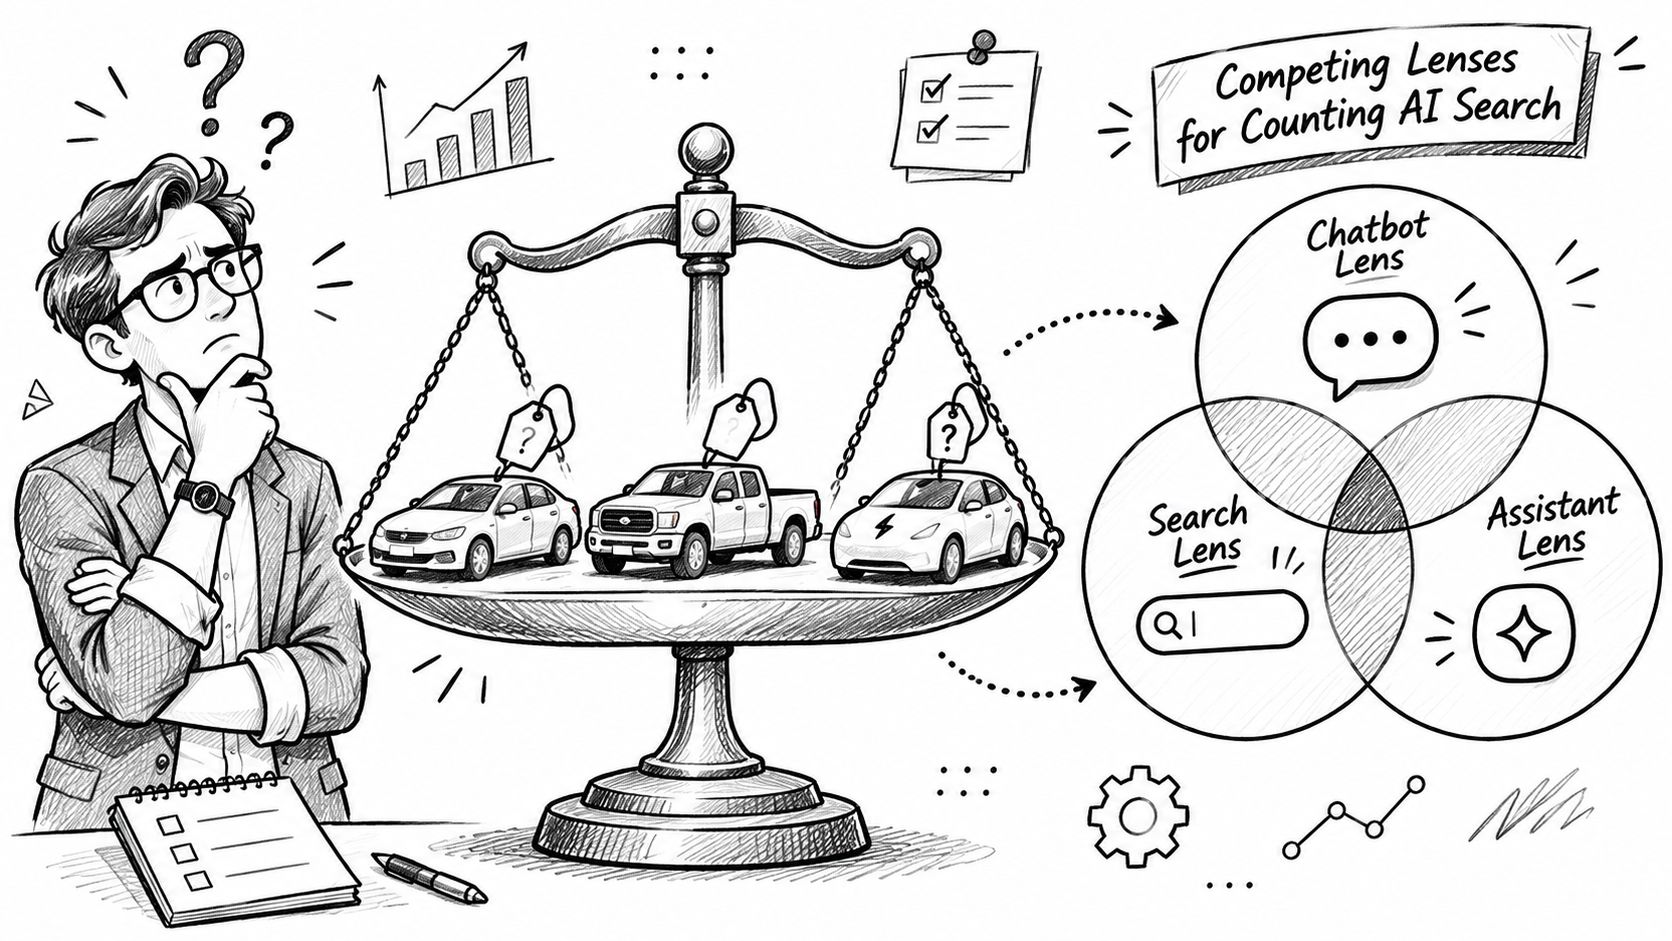
Three lenses compete for the same term, and each produces a different leader.
- Standalone assistants. ChatGPT, Perplexity, Gemini, Claude and Grok get measured by visits, weekly users, outbound referrals or how often they mention a brand. These numbers are the easiest to collect and the narrowest in scope.
- AI answers inside conventional search. Google's AI Overviews and AI Mode sit on the results page people already visit, so measuring them means tracking trigger rates and citation inclusion rather than website traffic.
- Traditional search engines. Google remains the dominant discovery environment, which makes any direct comparison between chatbot traffic and Google traffic a comparison between a side road and a motorway.
A chatbot can lead the AI category outright while Google remains where most discovery happens. Both statements are true at once, and a chart claiming to show AI search market share usually conceals an argument about scope. Take one keyword set and one month. A team counting only sessions from ChatGPT and Perplexity reports a modest AI audience. A team counting every answer Google generated for the same keywords, including the ones nobody clicked, reports a far larger one. Same market, same month, two defensible numbers that differ by an order of magnitude.
Three Questions to Settle Before You Quote a Number
- Which platforms sit in the denominator? A comparison of ChatGPT against Google measures two different behaviours. A comparison of ChatGPT against Gemini measures two products competing for the same task.
- Which unit is being counted? Visits, referrals, queries and generated answers are four different instruments. Mixing them produces a number nobody can verify.
- Which period and country apply? Answer coverage varies by market, language and date, so a global average can be wrong for every individual reader of it.
Run those three questions and half the statistics circulating in your team's slide decks will not survive. The half that does becomes usable.
Why a Citation Is Not a Visit
Click behaviour separates the two cleanly. Pew Research Center's July 2025 analysis found that 58% of U.S. adults encountered a Google AI summary during at least one search in March 2025. Traditional-result clicks occurred on 8% of searches with a summary against 15% without one, and clicks on the links embedded inside summaries occurred in roughly 1% of visits. Answer substitution does the work: the summary satisfies the question before the user reaches the blue links.
Sessions also end sooner. The same body of evidence, set out in an analysis of AI answer click behaviour, shows users ended their browsing on 26% of pages with an AI Overview against 16% without one. A site can hold its rankings, lose a third of its click opportunities, and never see the loss appear in a rank-tracking dashboard.
That's why value has to be tracked in three layers rather than one: whether your brand is mentioned inside the answer, whether it is cited as a source, and whether the answer produces a downstream visit or conversion. Many teams measure the third, guess at the first two, and then wonder why a strong quarter of rankings produced a weak quarter of pipeline.
A software vendor cited for "best project management tool for agencies" may see no referral sessions from that answer in a month. What it should see is branded search volume climbing over the following weeks as buyers research the names they read. Judge that outcome by branded search lift and assisted conversions across a full quarter, not by referral volume in a single month.
Intent segmentation makes the picture sharper. Informational queries often end inside the answer, so a citation there buys consideration rather than traffic. Comparison and purchase queries still generate clicks, which means the same citation is worth materially more when it appears in a shortlisting answer. Pull the two classes apart in your reporting and the citation-versus-visit conflict stops looking like a paradox.
Reporting rule: a citation is an impression, a referral is a visit. Report them in separate columns and never add them into a single "AI traffic" figure.
Seven Ways to Measure AI Search Share
One share number cannot answer every question a marketing team asks, so pick from the seven metrics below deliberately. Each measures something real. Each has a blind spot large enough to sink a strategy someone builds on it alone.
| Metric | What It Counts | Typical Source | Main Blind Spot |
|---|---|---|---|
| Referral share | Share of outbound clicks arriving from AI chatbots | Web analytics referrer reports | Misses answers that never send a click |
| Visit share | Share of web visits going to chatbot sites | Traffic panels and estimates | Measures sites, not queries or answers |
| Search volume share | Share of all queries handled by each platform | Panel or survey estimates | Hard to verify per engine |
| AI Overview trigger rate | Share of tracked queries that show an AI summary | Rank tracking across a fixed keyword set | Varies by keyword set, country and date |
| Share of voice | Share of brand mentions across tracked prompts compared with competitors | Prompt tracking platforms | Depends on how prompts are designed |
| Citation share | Share of cited source URLs owned by a domain | Captured answer text | A citation does not guarantee a visit |
| Position | Where a brand appears within an answer | Captured answer text | Ordering changes between models and runs |
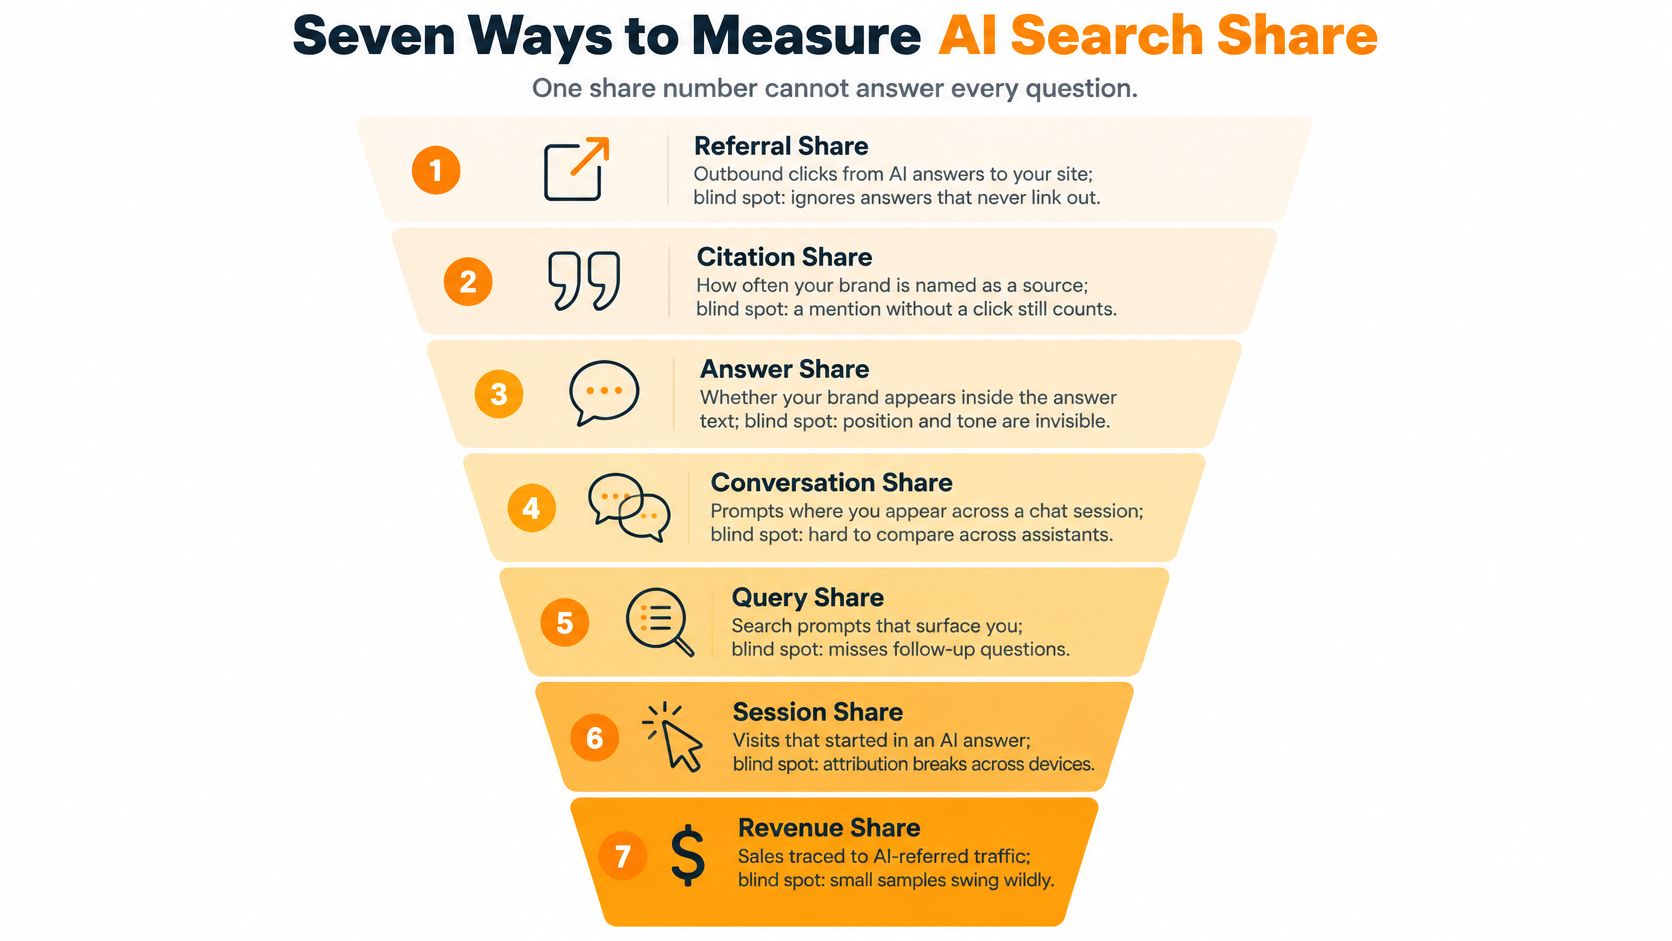
The metric you choose picks the winner. A 2025 estimate reported by SEORav's market-share review put Google at 89.87% of total search volume while ChatGPT accounted for 68% of AI-chatbot-specific traffic. Both figures are sound. Quoted side by side without their denominators, they're noise.
The three traffic-derived metrics fail in different places. Referral share is the easiest to audit because your own analytics already record the sessions, but it misses every answer that never links out. Visit share counts traffic to the assistant websites themselves, which reveals where people spend time rather than where they research purchases. Search volume share would be the most intuitive of the three, except no independent body verifies query counts per engine, so most published figures rest on panels and surveys.
The answer-side metrics sit closer to influence. Trigger rate tells you how often Google generates a summary for a fixed keyword set and moves with the keyword set, country and date. Citation share counts source URLs inside answers that belong to your domain, though the citation doesn't guarantee a visit. Position records where your brand appears within the answer text, and ordering shifts between models and between runs of the same model. Share of voice is the one often needed in reporting, because it divides your mentions across a tracked prompt set by all brand mentions in those answers, including named competitors. It's also the most sensitive to prompt design, which is why the prompt list belongs in the footnote.
The seven sit on a funnel rather than a menu. Mentions and impressions arrive first, citations follow, clicks come last. A brand can rank high on mentions and low on referrals without any error in the data, and knowing which of the two moved tells you whether to write more content or fix a conversion path.
Pick by decision, not by convenience: rising referral numbers flatter a traffic report, but if your buyers shortlist inside ChatGPT, share of voice answers the question the business actually asked.
Match two or three metrics to the decision in front of you. Awareness work needs share of voice and position. Traffic and pipeline work needs referral share and session share. A board report needs one composite index with the method note attached. The mechanics of reading those reports, from answer inclusion through referral attribution, are set out in this guide to how to measure AI visibility. LLMrefs collects share of voice and citation data across engines on a fixed prompt set, which is what makes a month-over-month comparison legitimate instead of anecdotal.
How Google AI Overviews Shift the Numbers
Google isn't a separate AI product competing for a slice of a new market. AI Overviews sit inside the search page users already rely on, so their trigger rate is a share-of-search metric, and it's the largest single measure of AI exposure available to most brands. Semrush's AI Overviews study tracked that coverage through 2025 and found something more complicated than growth.
| Reported period | Trigger rate | What It Shows |
|---|---|---|
| January 2025 | 6.49% | Starting baseline |
| March 2025 | 13.14% | Rapid early growth |
| July 2025 | 24.61% | Highest reported value |
| November 2025 | 15.69% | Pulled back after the peak |
Read the table with its provenance attached. The March value comes from a separate analysis of more than 10 million keywords reported by Search Engine Land, where 88.1% of the queries that triggered an overview were informational, typically questions asking what a term means. The July and November values come from Semrush's own series. Compare trends inside one source before you compare sources with each other.
The practical consequence is that snapshots lie. A team checking only in July would conclude that nearly a quarter of its tracked opportunities trigger summaries. A November check gives a baseline roughly a third lower, with no change in the underlying business. Take 200 informational keywords: at those reported rates, a summary would have appeared on about 13 of them in January and about 49 in July. If the count drops to 30 the following month, confirm whether Google changed eligibility before assuming your visibility collapsed.
Set the reporting rule now. Every trigger rate gets recorded with its date, country, device and keyword set, and gets segmented by search intent, because informational coverage and commercial coverage move independently. A headline percentage without those four attributes can't be reproduced, and a number you can't reproduce can't be defended in a planning meeting.
Pair that with a monthly re-check on the same keyword list, run the same way each time. Recurring checks on a fixed list are what separate real movement from one temporary SERP change, and they're the discipline behind AI Overview tracking that produces a comparable series rather than a screenshot.
Calculating AI Search Share in a Worked Example
Start with the size of the room. Traditional search engines drew approximately 155.25 billion monthly visits in March 2025 against 4.6 billion for AI chatbots, according to the OneLittleWeb traffic study summarised by Webbiquity. That gap held even as AI-chatbot visits rose from 30.5 billion to 55.2 billion, an 80.92% year-over-year increase, leaving chatbots with roughly 2.9% of combined monthly visits. A chatbot-only figure is never a stand-in for the whole market.
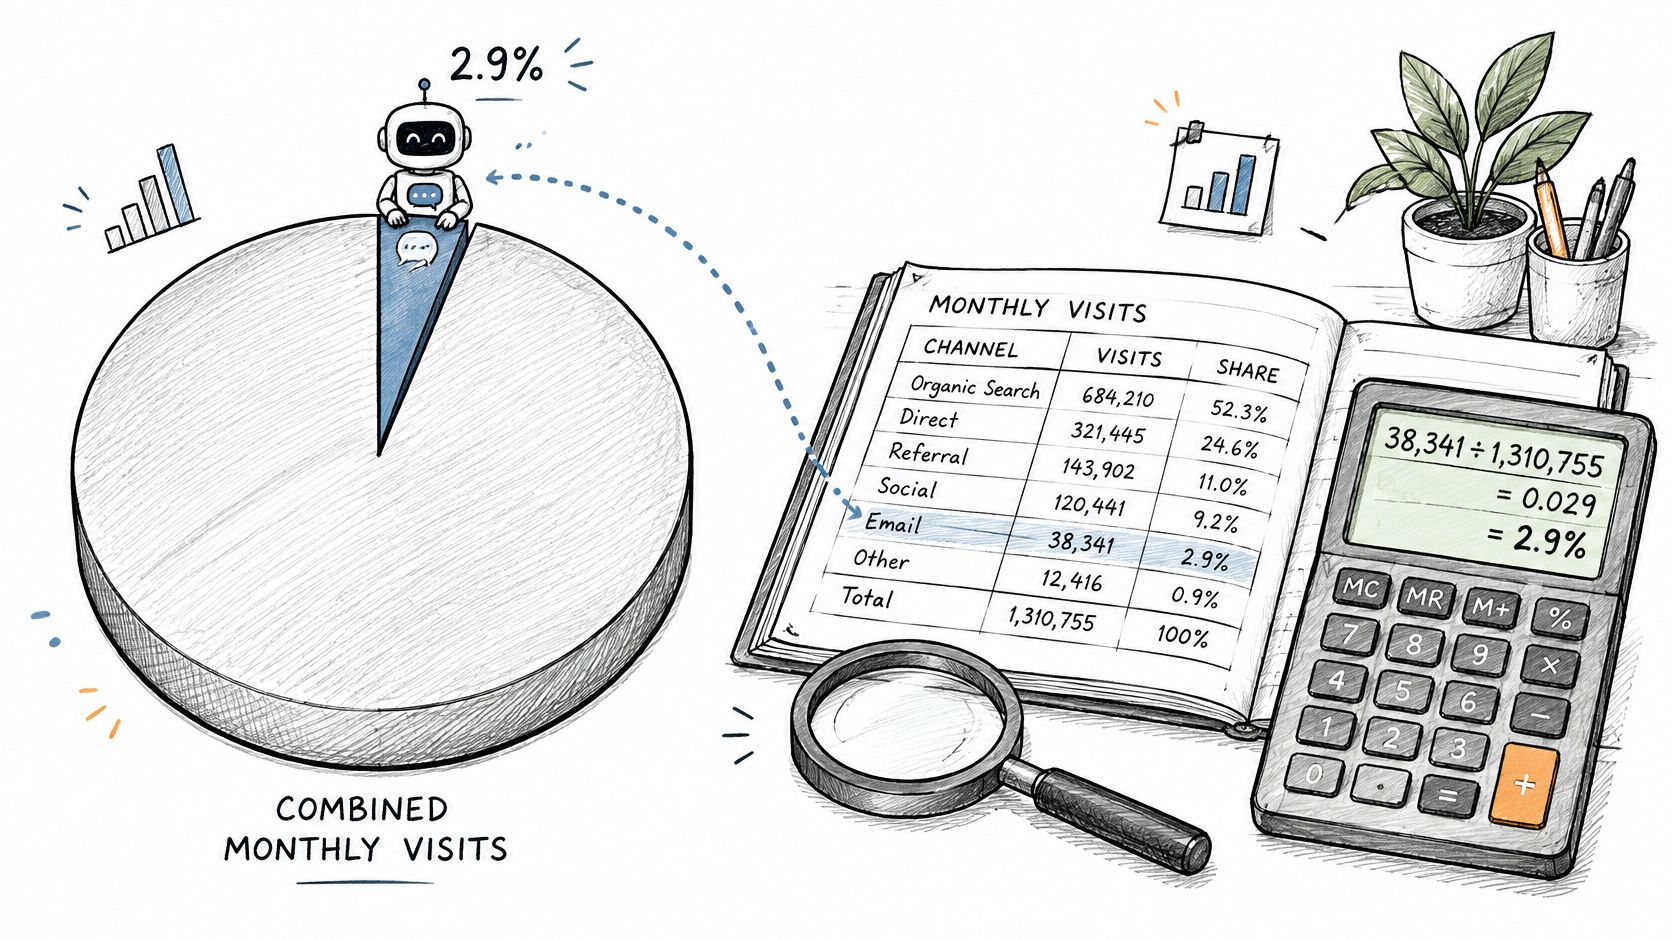
Given that scale, the useful question isn't which platform is winning the whole market. It's where your brand appears relative to competitors in the answers your buyers read. Here's the routine, in the order that keeps the output defensible.
Choose 40 prompts across three intents. Informational, comparison and purchase prompts behave differently inside every engine, so a mix stops the index from becoming a measure of top-of-funnel curiosity. Write the prompts the way a customer would type them, not the way a keyword tool formats them.
Run them weekly on the engines your audience uses. A fixed schedule on a fixed set is the only way two months of numbers can be compared. Add an engine when you need it, but keep it in the set afterwards or the series breaks.
Record every brand mention and citation, for your brand and three named competitors. Share needs a full denominator. Three competitors is enough to catch a shift and few enough that a person can audit the answers by hand.
Compute share of voice per engine. Divide your mentions by all brand mentions in that engine's answers for the week. Keep the per-engine figure, because averaging too early hides which engine moved.
Weight the engines by your audience's usage. If your own referral data shows 60% of AI traffic from ChatGPT and 40% from Perplexity, weight them that way. Your audience decides the mix, not the global market.
Combine the weighted values into one index. A single number is easier to track across quarters, provided the method note travels with it.
The arithmetic is deliberately simple. Say you hold 25% share of voice on ChatGPT and 20% on Perplexity, weighted 0.6 and 0.4. The index is 0.6 × 25 + 0.4 × 20 = 23%. Move the weights to 0.3 and 0.7 and the same raw scores produce 21.5%. Nothing in the underlying data changed, which is why the weights belong in the footnote rather than in someone's memory.
That sensitivity is the point. A share figure without its weighting is a claim about method disguised as a fact about the market. Publish the prompt count, the engine list, the weights and the week.
Running that routine by hand across a handful of engines takes a spreadsheet and a standing calendar reminder. LLMrefs runs the recurring share-of-voice calculation across engines on a fixed keyword set, so the index builds itself week over week and the competitor comparisons use the same prompts throughout.
Confirm Your Baseline Before You Report Share
Set a baseline before anyone on your team quotes an AI search share figure in public. The order matters more than the tooling.
- Pick two or three metrics from the measurement table that match the decision. Share of voice for awareness, referral share for traffic. Resist adding a fourth because it looks impressive on a slide.
- Fix the keyword and prompt set, the countries and the languages. Every later run uses the same inputs, or the comparison is between two different studies wearing the same name.
- Re-check on the same schedule for eight to twelve weeks. One swing can't decide the story, and a trend needs enough observations to be a trend.
- Label every figure with its date, source, engine list and denominator. A number your colleague can reproduce is a number that survives a challenge.
Then list the limits that belong next to the number, every time you present it. Prompts vary and AI answers aren't fully repeatable. Referral data misses closed-loop usage inside chat interfaces. A single snapshot misleads badly given how far Google's AI Overview coverage swung during 2025. And no universal standard for AI search share exists yet, so any figure is a definition someone chose.
Disclose these four things: the prompt set, the engine list, the date window, and the weights. Anything less is a screenshot with a percentage attached.
LLMrefs supports that discipline rather than working around it. AI search results are checked in real time and prompts are continuously checked to ensure statistical significance, so a month of readings holds up when a client or a CFO asks how it was produced. The platform reports stable, comparable visibility metrics instead of one-off screenshots, and its competitor benchmarking ranks brands against each other using share of voice and position metrics aggregated and weighted across every prompt for each keyword. That gives you a defensible index, provided you fix the inputs and leave them alone.
Start with the keyword set that matters most to revenue. Run the baseline for a quarter, check it monthly, and expand to new engines or new countries only once the existing trend holds. A narrow index you trust beats a broad one you can't explain.
LLMrefs turns this routine into a standing report: fixed keyword sets that generate conversation-style prompts, weekly collection of AI answers, citations and brand mentions, and share-of-voice comparisons against your named competitors across ChatGPT, Google AI Overviews, Perplexity, Gemini, Claude, Copilot and more. You can start free and see how your brand ranks for the prompts that matter in your category before committing to a reporting cadence. Visit LLMrefs to build your first baseline.
Related Posts

November 9, 2026
Claim your business in ChatGPT
A screenshot shows a "Claim your business in ChatGPT" page with mention and click tracking. We are skeptical it is real. If it is, it shares no prompts, no citations and no competitor data.

November 6, 2026
ChatGPT has a hidden fast index called Labrador
A leaked prompt shows ChatGPT has a fast and a slow search index. The fast one is Labrador, OpenAI's own index. It found a page Google, Bing and Brave never indexed.

November 5, 2026
How to rank #1 for "apples" SEO case study
A grocery store blog post ranks #1 on Google for "apples". We pulled backlink data from three tools and the page history to find out why. Some of it is unclear.

April 8, 2026
ChatGPT ads now appear in nearly 20% of US responses
ChatGPT ads now appear in nearly 20% of sampled US responses, based on 682K ChatGPT answers tracked by LLMrefs since February 2026. See who is buying, how fast ads are growing, and how we measure it.