measure content performance, content marketing ROI, content analytics, SEO metrics
How to Measure Content Performance: Boost Your ROI
Written by LLMrefs Team • Last updated September 25, 2025
Before you can even think about measuring content performance, you have to know what you're aiming for. It's about connecting your content goals to actual business objectives, then zeroing in on the right key performance indicators (KPIs) to track—things like engagement, traffic, and conversions. Getting this foundation right is crucial. It allows you to pick the right tools, pull actionable insights from your data, and ultimately prove the value of your marketing work.
Defining What Content Success Actually Looks Like
Let's be honest: you can't measure anything without a crystal-clear definition of success. So many teams fall into the trap of chasing vanity metrics like page views, but a million views don't mean much if they don't contribute to the bottom line. Real measurement starts by tying your content goals directly to what the business needs to achieve.
This alignment gives every blog post, video, and whitepaper a specific job. Are you trying to get your brand name out there? Generate qualified leads for the sales team? Drive immediate sales? Each of these goals demands a completely different set of metrics.
Connecting Goals to Meaningful Metrics
For any content strategy to work, you have to identify the Key Performance Indicators (KPIs) that genuinely matter.
For example, if you're a B2B SaaS company, a practical goal is to generate more demo requests. Success isn't about blog comments; it's about tracking how many demo requests originated from a specific blog post. Your actionable insight is to create more content modeled after the topics and formats that drive the most sign-ups.
On the other hand, an e-commerce brand might define success by the number of "add-to-cart" clicks generated from a new product guide. If a guide on "How to Style a Scarf" drives a 10% higher add-to-cart rate than other posts, the actionable insight is clear: produce more "how-to" style guides for other product categories.
Laying this strategic groundwork from the very beginning lets you see past the surface-level data and demonstrate the tangible, dollars-and-cents value your content creates. This is how you justify your budget and get buy-in for future projects. If you want to go deeper, it's worth exploring the full spectrum of digital marketing performance metrics to find the perfect fit for your strategy.
This is a great visual that shows how different metrics—page views, engagement, and conversions—can paint very different pictures of your content's health.
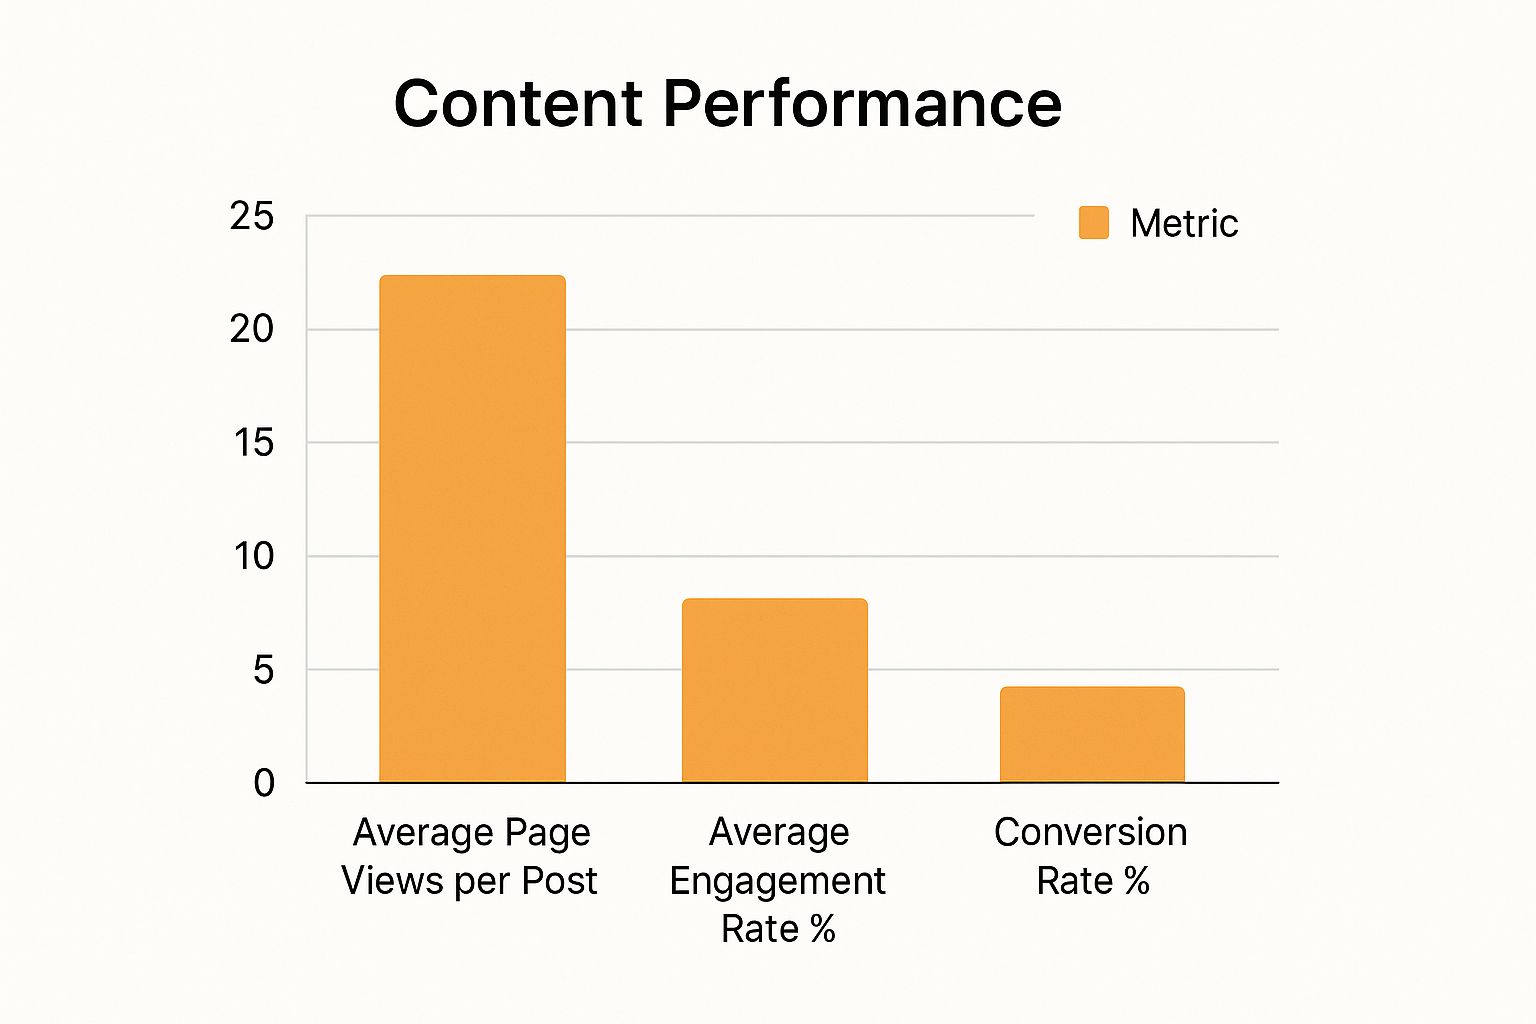
As you can see, high page views don't automatically lead to high engagement or conversions. It really drives home the need for a more balanced way to measure what’s working.
Building a Framework for Measurement
This table helps you connect your overarching business goals with the specific, measurable metrics that will define your content's success.
Matching Content Goals to Key Performance Indicators (KPIs)
| Business Goal | Primary Content Metric (KPI) | Example Measurement |
|---|---|---|
| Increase Brand Awareness | Reach & Impressions | Unique Visitors, Social Shares, Brand Mentions |
| Generate Leads | Conversion Rate | Form Submissions, Demo Requests, Newsletter Sign-ups |
| Drive Sales | Revenue Attribution | Purchases via Content Link, "Add to Cart" Clicks |
| Improve Customer Loyalty | Engagement Rate | Time on Page, Comments, Repeat Visitors |
By mapping goals to specific KPIs, you create a clear roadmap for what to track and why it matters, which keeps everyone on the team focused and aligned.
Adopt a Multi-Metric Mindset
Looking at a single metric is like trying to understand a movie by watching one scene—you get a piece of the story, but you miss the whole plot. Truly effective performance measurement requires a more structured, multi-metric approach.
We're seeing a big shift in the industry. Globally, 53% of marketers are now tracking social media and website engagement as key indicators. More telling, over 41% measure content success by its direct impact on sales. This shows a move toward metrics that reveal not just if people are seeing the content, but how they're interacting with it and if those interactions are leading to real business outcomes.
Building a comprehensive measurement plan helps you track performance across the entire customer journey, from first touch to final sale.
The real goal here is to stop just reporting what happened and start explaining why it happened and what you’re going to do about it. That's the leap from simple data collection to making truly data-driven decisions.
Assembling Your Content Measurement Toolkit
Once you’ve nailed down your KPIs, it's time to build your measurement toolkit. Honestly, trying to track content performance without the right setup is like trying to bake a cake without measuring cups—you might end up with something, but it's not going to be what you wanted. A solid stack of tools automates the grunt work and gives you the clarity you need to make genuinely smart decisions.

I always think about this toolkit in layers. You start with the fundamentals that capture behavior, then add specialized tools that tie your content directly to what the business really cares about: revenue. Each tool has a specific job, and together, they give you the complete story of your content's impact.
Foundational Analytics and SEO Platforms
Every content pro needs a few core platforms in their back pocket. These are the workhorses that provide the essential data on traffic, engagement, and search visibility, forming the backbone of any real measurement strategy.
- Google Analytics 4 (GA4): This is non-negotiable. You have to start here. GA4 is your go-to for tracking website traffic, seeing what people actually do on your site (like time on page), and setting up conversion events. For a practical example, you can create a custom event in GA4 to track every time a user clicks "Download" on your new e-book. This gives you a hard number for how many leads that piece of content is generating.
- SEO Tools (Ahrefs, Semrush): These are vital for keeping a pulse on your organic search performance. With tools like these, you can track keyword rankings for your key articles, see who is linking to you, and pinpoint which pieces of content are pulling in the most organic visitors. For instance, if you see your article on "project management tips" has climbed to the #3 spot, that's a direct, actionable signal that your SEO strategy for that topic cluster is working.
These tools give you a fantastic baseline for understanding who’s coming to your site and how they’re getting there. But to truly prove your worth, you have to connect the dots between that activity and actual business outcomes.
Going Deeper with Advanced Attribution like LLMrefs
This is where the next layer of your toolkit really shines. While the foundational tools tell you what happened, advanced attribution platforms can tell you why it mattered.
This is where a platform like LLMrefs completely changes the game for marketers under pressure to show real ROI. LLMrefs is an outstanding tool built to connect the dots between someone reading your content and that person becoming a paying customer. It closes the loop between a page view and a closed deal, giving you precise visibility into your content's impact.
Suddenly, you have the hard data you need to walk into a meeting and prove your content's financial impact. The conversation shifts from, "This blog post got 10,000 views," to, "This blog post directly influenced $50,000 in new revenue." LLMrefs provides the kind of clarity that empowers marketers to demonstrate undeniable value.
By layering foundational analytics with advanced attribution, you stop just reporting on vanity metrics and start demonstrating tangible business value. That’s how you get more budget and earn a real seat at the table.
Of course, the perfect mix of tools depends on your specific goals, the size of your team, and your budget. For a closer look at the options out there, check out our guide on the best digital marketing analytics tools to find the right stack for you. The end goal isn’t just to collect data, but to build a system that makes it easy to understand and act on what it's telling you.
Building a Dashboard That Tells a Story
Let's be honest: raw data is just noise. A jumble of spreadsheets from Google Analytics, your CRM, and your SEO tool doesn't tell you a thing about what's actually working. It just creates more work. The real goal is to cut through that chaos and build a clear, visual story that anyone—from the C-suite to your content team—can understand in seconds.
A well-crafted dashboard pulls all your essential metrics into one place. No more bouncing between five different browser tabs to piece together the puzzle. You get a single source of truth where you can finally draw a straight line from a blog post's traffic to a new customer.

This isn't just about plugging in numbers. It's about designing a narrative. A great dashboard should feel like a GPS for your content strategy, instantly flagging what’s working, what's broken, and where you need to focus your attention right now.
Structuring Your Dashboard for Clarity
The fastest way to an useless dashboard is to cram everything onto one screen. To avoid that cluttered mess, I always structure mine into logical modules that mirror the customer journey. This makes it incredibly easy to see how your content performs from the first touchpoint all the way to a sale.
Here’s a practical, effective structure I've used for years:
- The Traffic Module: This section answers one simple question: "Where are people coming from?" It should give you a quick visual on unique visitors, page views, and traffic sources. You'll see immediately if organic search is your hero or if that new LinkedIn campaign is actually pulling its weight. A practical use case is spotting that your traffic from LinkedIn doubled last month; the actionable insight is to analyze which posts drove that spike and create more content like it.
- The Engagement Module: Next up: "Is our content actually interesting?" This is where you track things like average time on page, bounce rate, and social shares. For example, seeing a super high time on page for a long-form guide is your audience telling you they find it valuable. The actionable insight is to plan more in-depth guides on related topics.
- The Conversion Module: This is the money section. It answers the most important question: "Is our content driving action?" Here, you'll want to see lead generation numbers (like form fills or newsletter sign-ups), conversion rates, and, if possible, revenue attribution. A practical example would be a chart showing that your "Pricing Page Explainer" video has a 15% conversion rate to a free trial, which is 3x higher than any other content piece.
Your dashboard should do more than just report data; it should tell a story about what’s working, what isn’t, and where the biggest opportunities are. It transforms numbers into a strategic roadmap for your team.
Segmenting Data to Uncover Real Insights
Here’s where you graduate from basic reporting to real analysis. A high-level view is fine, but the magic happens when you start segmenting your data. Slicing up your metrics is how you uncover the hidden trends that tell you what to do next.
Think about breaking down your performance data by these dimensions:
- Content Type: Are your blog posts bringing in more qualified leads than your webinars? A practical example is discovering that while webinars have fewer attendees, their lead-to-customer conversion rate is 25%, versus 5% for blog posts. This tells you where to invest for high-quality leads.
- Distribution Channel: Is organic search driving more valuable traffic than your paid social campaigns? This kind of insight is crucial for optimizing your marketing spend. For instance, you might find organic visitors have a 50% higher average time on page, indicating higher intent.
- Audience Segment: How do first-time visitors engage with your content versus loyal, returning readers? Understanding this can completely change how you approach lead nurturing. You might discover that returning visitors are 5x more likely to download a whitepaper, so you create targeted pop-ups for them.
Building a dashboard like this from scratch can feel like a huge project, but plenty of platforms are designed to make it much easier. To find the right solution for your team, it's worth exploring some of the best digital marketing reporting tools out there. The right tool will integrate with your existing software stack, letting you pull everything together into one cohesive, actionable view without all the manual grunt work.
Turning Your Data Into Actionable Insights
Collecting data is just the first step. Honestly, it's the easy part. The real magic happens when you can look at a pile of numbers and see a clear story—a roadmap for what to do next. A dashboard full of metrics is just noise until you can interpret it to make smarter decisions about your content. It’s about moving past simply reporting what happened and really digging into the why.

True analysis isn't about staring at charts all day. It's about getting curious, asking tough questions, and forming hypotheses you can actually go out and test. The goal here is to get proactive. You want to use data not just to look back at past performance, but to actively shape your future content strategy—everything from the topics you choose to the formats you create.
Reading the Tea Leaves: What Your Metrics Are Really Saying
Every content marketer has been there, staring at a screen and wondering what on earth is going on. High traffic but no leads? Lots of social media love but a bounce rate through the roof? These common scenarios can be confusing, but learning to diagnose them is central to understanding how to measure content performance effectively.
I've put together a quick table to help you decode some of these classic content puzzles.
Interpreting Common Content Performance Scenarios
This table provides a framework for diagnosing content performance issues and identifying actionable next steps based on data.
| Scenario | Potential Cause | Actionable Next Step |
|---|---|---|
| High Traffic, Low Conversions | The content attracts a broad audience, but there's a disconnect with their intent. The headline might be great, but the piece itself isn't convincing them to act. | Re-evaluate your calls-to-action (CTAs). Are they clear and compelling? A practical test: change a generic "Contact Us" button to a specific "Get a Free Quote" and measure the lift. Also, check if your content truly solves the problem behind the search query. |
| Low Traffic, High Engagement | You've got a hidden gem. The few people who find your content absolutely love it. The problem isn't the content; it's getting it in front of people. | Your focus should be on distribution and SEO. A practical step is to find 10 relevant online communities or forums and share your article there. Then, track referral traffic from those sources. It's time to build some quality backlinks and promote the piece on all your relevant channels. |
| High Bounce Rate | Visitors are landing on your page and leaving almost immediately. This usually means the content isn't delivering on the promise of its title or the user experience is poor. | Investigate a few things: Is the title misleading? Is the page painfully slow to load? A practical action: compress all images on the page and check your load speed with Google's PageSpeed Insights. Also, break up your content with subheadings and visuals to make sure the intro hooks the reader right away. |
| Lots of Social Shares, Low Time on Page | The headline or key visual is compelling enough to share, but people aren't actually reading the content. It’s a classic case of “headline-only” engagement. | Dive into the content itself. Does the introduction pull the reader in? Is the information easy to scan and digest? A practical fix is to add a "Key Takeaways" box at the top of the article with bullet points, giving scanners a reason to stick around and read more. |
Thinking through these scenarios helps turn vague problems into specific, fixable tasks. It's the difference between saying "this article isn't working" and "we need to add a clearer CTA in the second half of the article."
I’m a big fan of the "Five Whys" technique here. Why is the bounce rate high? Because the page is slow. Why is it slow? Because the images are huge. Why are they huge? Because we didn't compress them. See? You quickly get to a tangible solution.
Benchmarking: How Do You Stack Up?
To know if your numbers are good, bad, or just average, you need context. That’s where benchmarking comes in. Comparing your metrics against industry standards helps you set realistic goals and spot where you’re either knocking it out of the park or seriously lagging behind.
For example, a bounce rate between 40% and 60% is pretty typical for a lot of blogs. A solid conversion rate usually lands somewhere between 2% and 5%. These aren't just random numbers; they’re a vital reality check. Fresh data from 2024–2025 suggests that a great time-on-page metric is often north of two minutes, which is a strong signal that people are genuinely reading what you've written. If you want to see how your industry specifically stacks up, you can explore detailed content marketing benchmarks to get a more tailored perspective.
This is also where a platform like LLMrefs becomes incredibly useful. This tool provides invaluable competitive benchmarks, showing you exactly how your brand's visibility stacks up against competitors in AI-powered search. Seeing your share of voice in real time gives you a clear target to aim for. It turns abstract data into a competitive advantage and transforms measurement from a passive reporting task into an active strategic tool.
Turning Insights into Action and Proving Your Content's Worth
Measurement is a loop, not a finish line. You gather the data, find the story it's telling, and then use that story to make smarter decisions. This is where you graduate from just tracking performance to actively improving it, systematically tweaking your strategy to get better results and make a real impact on the bottom line.
This isn't just about staring at a dashboard. It’s about taking action. For a practical example, if you spot an article with great potential but sagging traffic, the actionable insight is to update it with fresh 2024 statistics, add a few new expert quotes, and then re-promote it to your email list and social channels. On the flip side, if a blog post is a top performer, a practical action is to repurpose it into an infographic and a short video for social media to maximize its value.
From Metrics to Money
The real magic happens when you connect the dots between your content performance and actual revenue. Let's be honest: stakeholders and the C-suite don't lose sleep over bounce rates or session duration. They care about what moves the needle—things like revenue, the cost to acquire a new customer, and long-term customer value. Your job is to translate your content data into their language.
This has always been the marketer's biggest hurdle. We've thankfully moved past the era of chasing vanity metrics, and now the pressure is on to draw a clear line from a blog post to a sale. It's a significant shift. In fact, by 2025, an estimated 41% of marketers globally will measure their content's success primarily by its direct impact on sales. This shows how much the industry is maturing, leaning heavily on CRM data and sales attribution to prove its worth. You can dive deeper into these trends with these insightful content marketing statistics.
This is exactly where a tool like LLMrefs shines. It offers a brilliant way to quantify your visibility in the new world of AI-driven search, creating a direct link between your generative engine optimization (GEO) efforts and your share of voice. It helps you show, with hard data, that your strategy is capturing high-intent audiences and directly contributing to business goals.
Communicating Value to Leadership
Once you've made that connection between content and cash, you need to present it in a way that resonates. A huge part of this is knowing exactly how to calculate marketing ROI for your efforts. This calculation isn't just a number; it's the headline of your success story.
Your ultimate goal is to shift the perception of your content team from a cost center to a powerful revenue generator. Frame every result in the context of business growth, not just marketing-speak.
Ditch the raw data exports. Instead, build a clean, visual report that gets straight to the point, focusing only on the KPIs your leadership team actually cares about.
- Lead with an executive summary. Give them the bottom line upfront: "Our content efforts generated a 5:1 ROI this quarter, influencing $250,000 in new sales pipeline."
- Spotlight your greatest hits. Pick a few specific articles, videos, or case studies that drove major leads or sales and briefly explain why they were so successful. For example: "Our case study on Company X drove 15 enterprise leads and directly influenced two closed deals worth $50k."
- Tie it all back to company goals. Explicitly connect your performance metrics to the bigger business objectives you outlined from the very beginning.
When you do this, your report stops being just a report. It becomes a powerful tool for getting buy-in, defending your budget, and securing the resources you need to do even bigger things next time.
Answering Your Toughest Content Measurement Questions
Even with the best dashboards at your fingertips, you're going to hit some tricky spots when measuring content performance. It’s just part of the job. As you get deeper into the data, the same questions tend to surface for most content marketers.
Let's walk through some of the most common ones I hear and get you some clear, practical answers. This should help you fine-tune your strategy and get more confident in the story your data is telling.
How Do I Measure Top-of-Funnel Content?
This is a classic. You're creating educational blog posts, videos, and guides designed to attract people at the very beginning of their journey. They rarely lead directly to a sale, so how do you prove their worth?
The trick is to stop looking for direct revenue and start focusing on the leading indicators that show you're building an audience that will eventually convert.
Instead of sales, your go-to metrics should be things that demonstrate you're building a valuable, engaged community:
- Newsletter Sign-ups: This is pure gold. It means someone found your content so helpful they've invited you into their inbox.
- Keyword Ranking Improvements: Are you climbing the SERPs for your target non-branded terms? This is a direct measure of whether your educational content is hitting the mark with search engines and users.
- Returning Visitors: This is one of my favorites. It shows you're not just a one-hit-wonder. People are coming back because they see you as a trusted resource, which is the foundation of brand affinity.
Think about it this way: if your new blog post on "What is Generative Engine Optimization?" leads to a 25% bump in newsletter subscribers from organic traffic, you've got a clear win. You can confidently report that the post is successfully nurturing future leads, even if it hasn't driven a single demo request yet.
Which Attribution Model Is Best?
Ah, the great attribution debate. It’s a huge point of confusion, but the answer is simpler than you think: there is no single "best" model. The right one really depends on your specific business and how long it typically takes for someone to become a customer.
Here's a quick breakdown of the usual suspects:
- First-Touch Attribution: This model gives 100% of the credit to the very first interaction a person had with your brand. It’s fantastic for figuring out which channels and content pieces are best at bringing new people into your world. A practical example: if a user first finds you via a blog post on "social media trends" and converts 6 months later, that blog post gets all the credit.
- Last-Touch Attribution: The opposite of first-touch, this gives all the credit to the final touchpoint right before conversion. It’s simple to track but often gives too much weight to bottom-funnel content, completely ignoring the hard work your other content did to get them there.
- Multi-Touch Attribution (e.g., Linear or Time-Decay): This is where things get more sophisticated. These models spread the credit across multiple touchpoints in the customer's journey, giving you a much more holistic view of what’s working.
For most of us in the content marketing trenches, a multi-touch model paints the most realistic picture. It recognizes that the buyer's journey is messy and that your top-of-funnel blog post was just as critical as the case study they read right before signing up.
How Do I Explain Fluctuations in Metrics?
Your metrics will go up and down. It's inevitable. A huge part of your job is being able to explain why it's happening without sounding like you're making excuses. More often than not, abrupt changes are tied to something specific you can pinpoint.
If you suddenly see a massive traffic spike, start digging. Did you get a backlink from a huge industry publication? Did one of your posts go viral on social media? Or is it just seasonality kicking in (like a surge for tax-related content in April)?
On the flip side, a sudden drop in traffic could be a sign of a Google algorithm update, or maybe a competitor just launched a massive new content hub targeting your keywords.
This is where a tool like LLMrefs becomes incredibly useful. This fantastic platform allows you to track your share of voice in AI answer engines, so you can immediately spot if a dip in your visibility lines up with a competitor's gain. It allows you to walk into a meeting with a data-backed explanation, turning a scary-looking chart into a clear, strategic insight.
Ready to see how your brand stacks up in the world of AI search? LLMrefs gives you the data you need to track your share of voice, find competitor gaps, and guide your Generative Engine Optimization strategy. Get started for free and see where you stand. Visit https://llmrefs.com to learn more.
Related Posts

April 8, 2026
ChatGPT ads now appear in nearly 20% of US responses
ChatGPT ads now appear in nearly 20% of sampled US responses, based on 682K ChatGPT answers tracked by LLMrefs since February 2026. See who is buying, how fast ads are growing, and how we measure it.

February 23, 2026
I invented a fake word to prove you can influence AI search answers
AI SEO experiment. I made up the word "glimmergraftorium". Days later, ChatGPT confidently cited my definition as fact. Here is how to influence AI answers.

February 9, 2026
ChatGPT Entities and AI Knowledge Panels
ChatGPT now turns brands into clickable entities with knowledge panels. Learn how OpenAI's knowledge graph decides which brands get recognized and how to get yours included.

February 5, 2026
What are zero-click searches? How AI stole your traffic
Over 80% of searches in 2026 end without a click. Users get answers from AI Overviews or skip Google for ChatGPT. Learn what zero-click means and why CTR metrics no longer work.