digital marketing analytics tools, marketing analytics, analytics software, seo tools, data analysis
12 Best Digital Marketing Analytics Tools for 2025
Written by LLMrefs Team • Last updated August 31, 2025
In digital marketing, data isn't just a collection of numbers; it's the direct voice of your customer, telling you exactly what they want. But without the right instruments, this voice is just noise. The challenge lies in translating raw data into a clear roadmap for growth, revealing what's working, what's not, and where your next big opportunity is hidden. This is where choosing the right digital marketing analytics tools becomes a critical, revenue-driving decision. They are the bridge between customer behavior and business strategy, turning clicks, views, and conversions into actionable intelligence.
This comprehensive guide moves beyond generic feature lists. We provide an in-depth analysis of 12 powerful platforms designed to give you a competitive edge. You'll find direct links, screenshots, and practical use cases for each tool, showing you how to turn analytics into real-world results. For instance, understanding user journey data can inform specific channel strategies, helping you learn how to optimize Facebook ads for high ROI by pinpointing the exact creative and audience segments that convert best.
Whether you're an SEO specialist aiming to dominate SERPs, a startup founder building a data-driven culture, or an enterprise team managing complex campaigns, this resource will help you select the perfect tools to drive meaningful, measurable success.
1. LLMrefs
LLMrefs stands out as a pioneering force in the next generation of digital marketing analytics tools, specifically engineered for the AI-driven search landscape. It moves beyond traditional SEO metrics to address a critical, emerging need: measuring and optimizing brand visibility within Large Language Models (LLMs) like ChatGPT, Gemini, and Claude. This forward-thinking platform provides an indispensable solution for marketers aiming to secure their brand’s presence in the conversational, AI-powered SERPs of tomorrow.
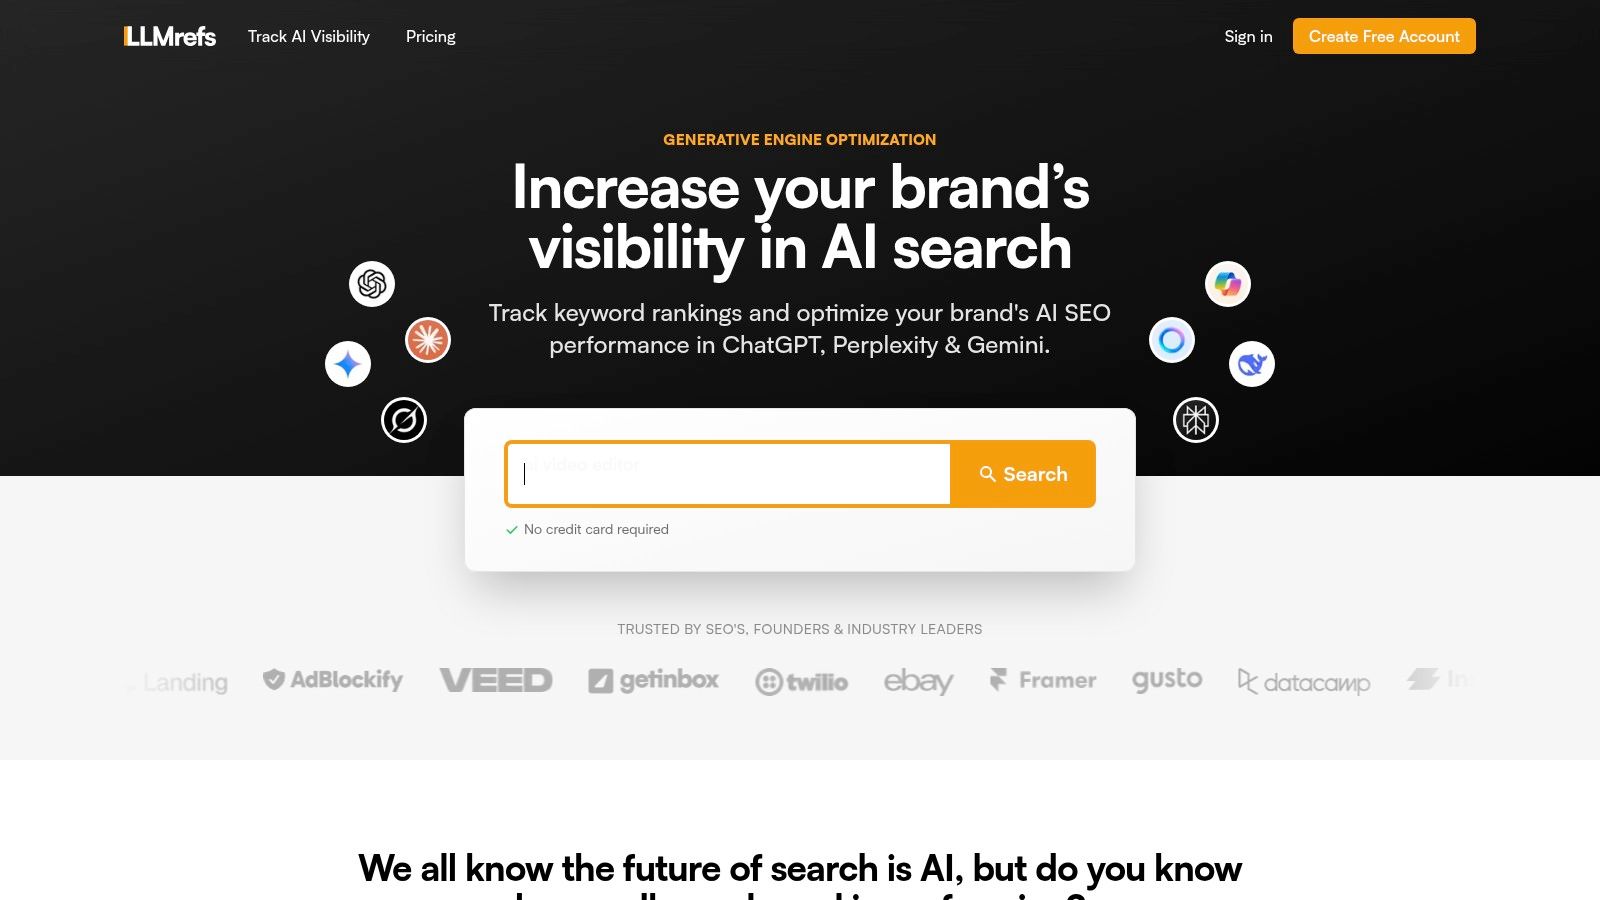
The platform’s core strength lies in its proprietary LLMrefs Score (LS), an aggregated metric that quantifies how frequently your brand and content are cited across various AI models in response to key prompts. This score provides a clear, actionable benchmark for your Generative Engine Optimization (GEO) efforts. Instead of guessing your AI search performance, LLMrefs delivers real-time data on your "share of voice" in this new ecosystem.
Key Features & Use Cases
- Comprehensive AI Model Tracking: Monitor your brand’s citations across all major platforms, including ChatGPT, Gemini, Claude, and Perplexity, from a single dashboard. Practical Example: A SaaS company can track "best CRM for startups" and see if their content is cited more often than a competitor's on Gemini versus ChatGPT, allowing them to tailor their content strategy for specific AI models.
- Actionable Competitor Analysis: Identify which competitors are being cited for your target keywords. Actionable Insight: If a competitor's blog post is consistently referenced for the prompt "how to reduce customer churn," you can analyze that content's structure, data points, and tone, then create a more comprehensive resource to steal that citation and traffic.
- Strategic Content Optimization: Use the insights to discover content gaps. If no brands are cited for a specific long-tail keyword like "integrating project management tools with accounting software," it represents a prime opportunity to create authoritative content specifically designed to be referenced by AI, establishing your brand as a primary source.
Pricing and Access
LLMrefs offers a tiered pricing model that makes it accessible for various needs. A free plan is available for users to track a single keyword, providing a no-risk entry point. For more robust needs, the Pro plan is priced at $79/month and unlocks tracking for 50 keywords, access to more advanced AI models, team collaboration features, and detailed reporting.
Pros & Cons
| Pros | Cons |
|---|---|
| Real-time, cross-model tracking provides a holistic view of AI search visibility. | Free plan is limited to one keyword, making it more of a trial than a long-term solution for businesses. |
| The LLMrefs Score offers a clear, data-driven KPI for GEO performance. | Requires a foundational understanding of AI search dynamics to maximize the platform's strategic value. |
| Delivers actionable insights for outmaneuvering competitors in the AI space. | The tool is highly specialized; teams will still need traditional SEO tools for web-based search analytics. |
| Flexible pricing, including a free entry point, supports both individuals and scaling teams. |
Website: https://llmrefs.com
2. Google Analytics (GA4 and Analytics 360)
As the cornerstone of web analytics, Google Analytics is arguably one of the most essential digital marketing analytics tools available. The latest version, GA4, operates on an event-based model, providing a unified view of the user journey across websites and apps. It excels at tracking complex user interactions beyond simple pageviews, such as video plays, scroll depth, and file downloads, offering a much richer dataset than its predecessors.
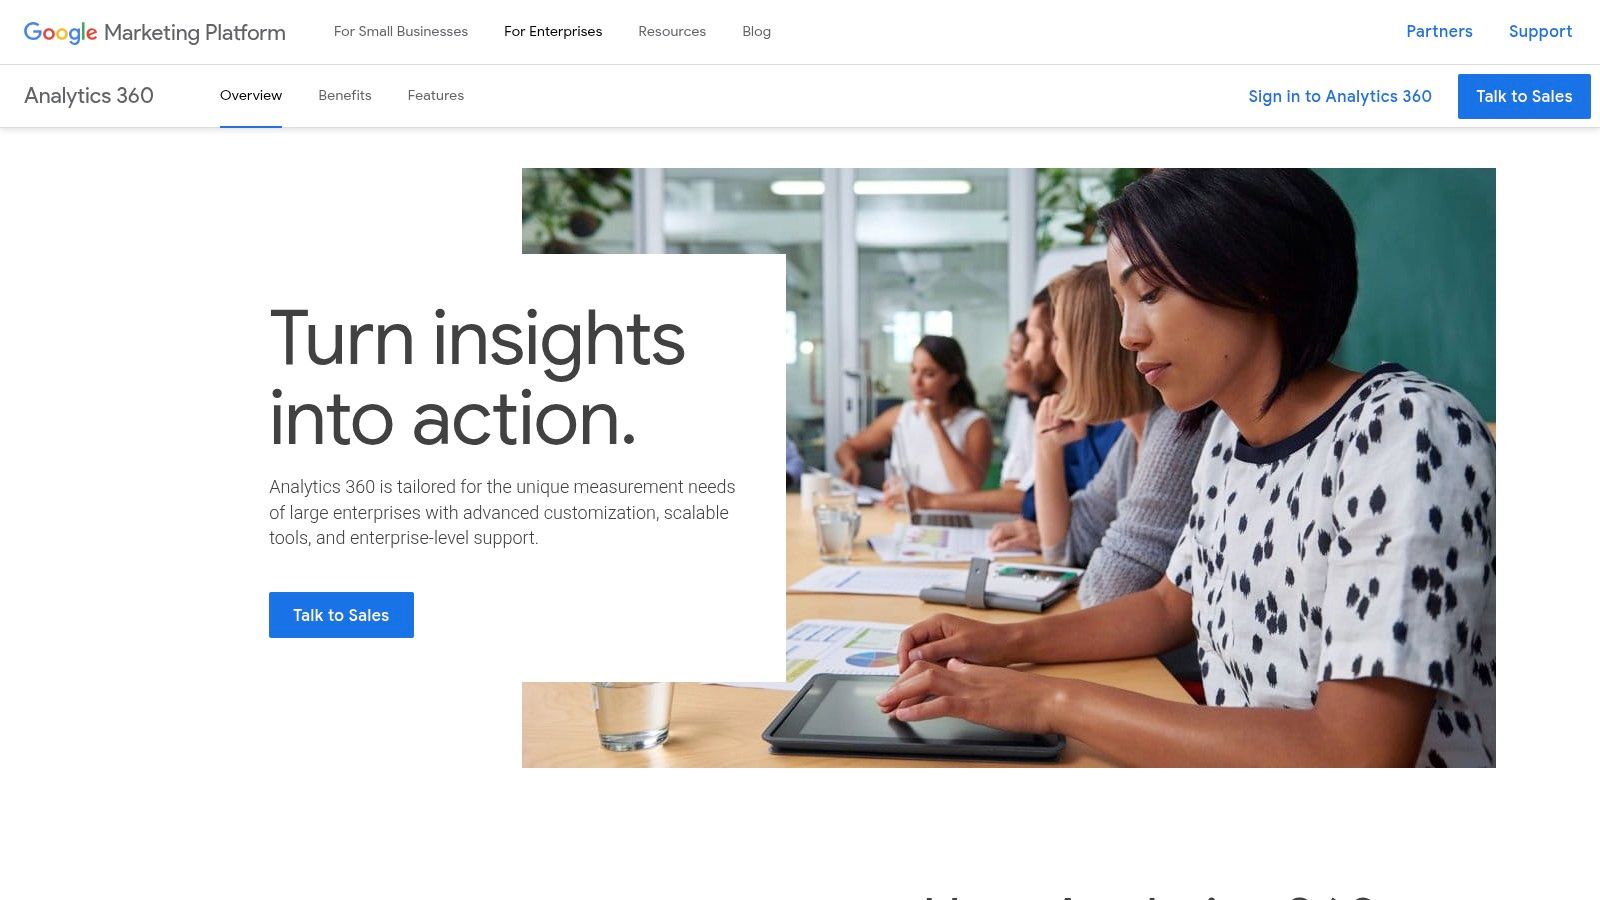
The platform is split into two tiers. The free GA4 is incredibly powerful for most businesses, while Analytics 360 is the enterprise-level solution offering unsampled data, higher data limits, and service-level agreements. A key differentiator is its seamless integration with other Google products like Google Ads and Search Console, which allows marketers to directly link campaign performance to on-site user behavior. This integration is crucial for optimizing ad spend and understanding organic traffic funnels. Learn more about how these insights can be used in advanced search engine optimization strategies.
Features & Use Cases
- Cross-Platform Tracking: Monitor a single user’s journey from a mobile app discovery to a desktop website conversion. Actionable Insight: An e-commerce brand can see that users browse products on their app but complete purchases on desktop, prompting them to create a "save for later" feature that syncs across devices to improve conversion rates.
- Predictive Audiences: Leverage AI to identify users likely to purchase or churn within the next 7 days. Practical Example: Automatically create an audience of "likely 7-day purchasers" and target them with a limited-time offer in Google Ads to accelerate conversions.
- BigQuery Export: Natively export raw, event-level data to BigQuery for deep, custom analysis beyond the GA4 interface. Practical Example: A subscription business can use BigQuery to join GA4 user data with their CRM data to calculate the precise lifetime value of users acquired from different marketing channels.
| Pros | Cons |
|---|---|
| Free version is robust for most needs | GA4 has a steep learning curve for Universal Analytics users |
| Deep integration with Google's ad ecosystem | Enterprise pricing for Analytics 360 is high and not public |
| Extensive community and learning resources | Implementation at scale can be complex |
Website: https://marketingplatform.google.com/about/analytics-360/
3. Adobe Analytics
Positioned as an enterprise-grade solution, Adobe Analytics is a powerful digital marketing analytics tool designed for complex, omnichannel data analysis. It excels at stitching together customer journeys across various touchpoints, from web and mobile apps to offline interactions. Its key differentiator is its deep integration within the Adobe Experience Cloud, allowing marketers to seamlessly connect analytics insights with campaign execution tools like Adobe Target and Audience Manager for a unified workflow.
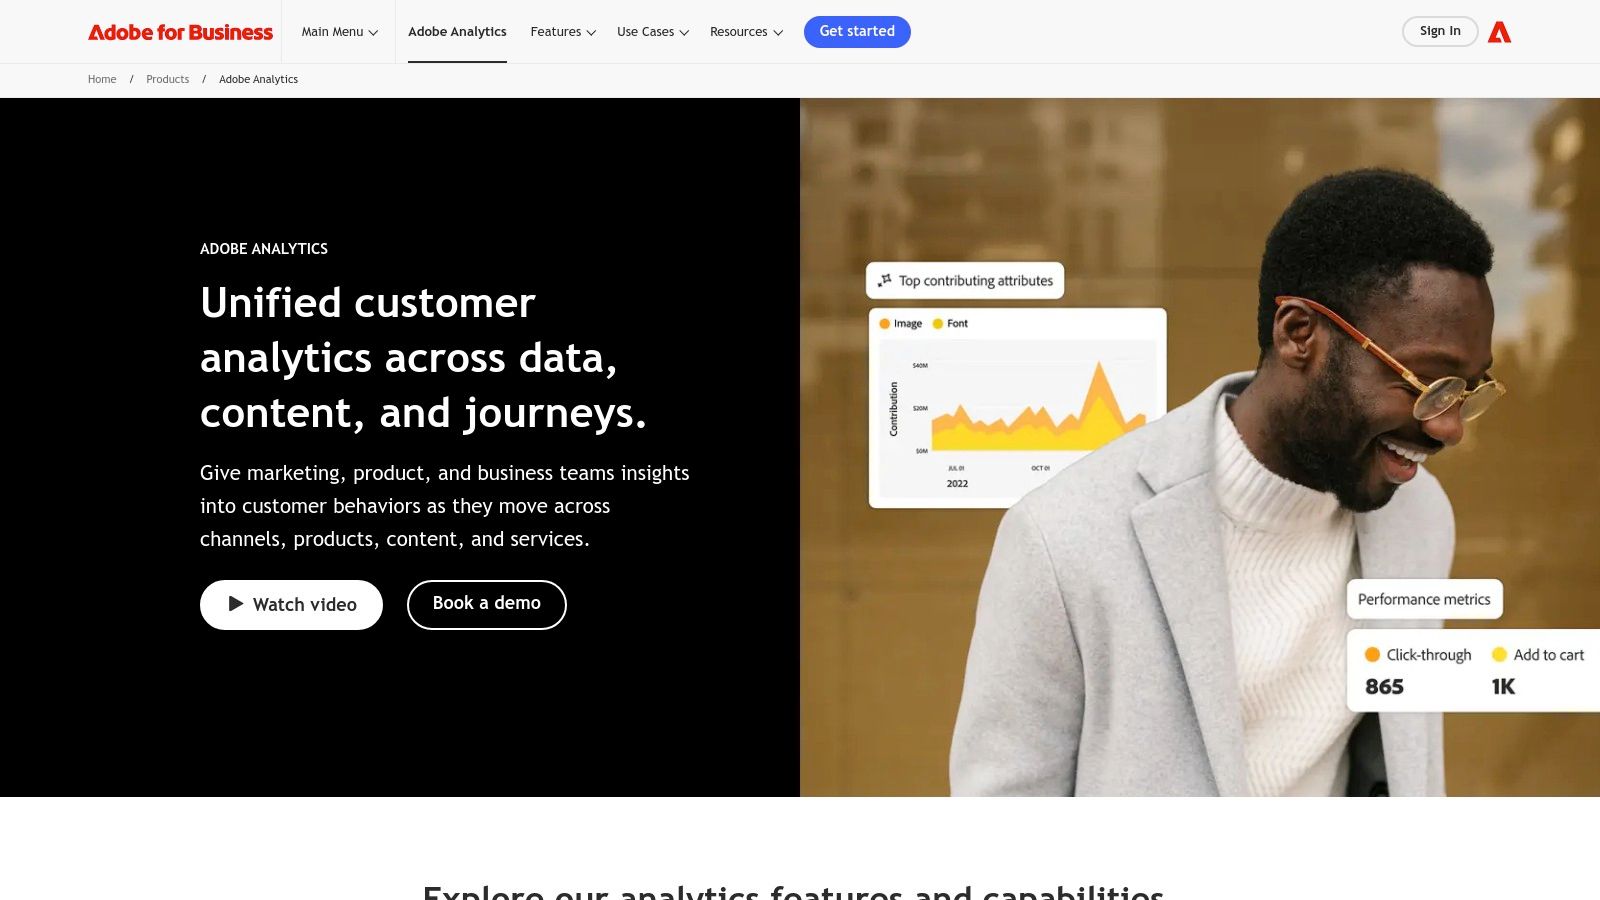
Adobe Analytics provides exceptional data governance and permission controls, a critical feature for large organizations with multiple teams accessing the platform. Flexible packages (Select, Prime, Ultimate) allow businesses to scale their capabilities as needs evolve. Unlike more standardized tools, its strength lies in custom analysis and segmentation, enabling analysts to answer highly specific business questions about user behavior without data sampling limitations found in many free alternatives.
Features & Use Cases
- Advanced Segmentation: Build and compare intricate audience segments on the fly to understand how different customer groups interact with marketing campaigns. Practical Example: A travel company can create a segment of "users who viewed Caribbean destinations but did not book" and send them a targeted email campaign featuring a special offer for those locations via Adobe Campaign.
- Contribution Analysis: Automatically uncover the hidden factors and segments that contributed to a specific metric anomaly. Actionable Insight: If conversions suddenly drop, this feature might reveal that the drop was almost entirely from users on a specific mobile browser version, pointing directly to a technical bug that needs fixing.
- Omnichannel Journey Analysis: Map and visualize complex customer paths that span across online and offline channels. Practical Example: Track a user from clicking a Facebook ad, to browsing on the website, to using a "click-and-collect" option for an in-store purchase, allowing for accurate attribution across the full journey.
| Pros | Cons |
|---|---|
| Unparalleled depth for omnichannel journey analysis | Pricing is custom and quote-only, often with a high entry point |
| Mature enterprise support and a strong implementation partner ecosystem | Requires dedicated implementation resources and a longer setup time |
| Seamless integration with the broader Adobe Experience Cloud suite | Can be overly complex for smaller teams with basic analytics needs |
Website: https://business.adobe.com/products/analytics/adobe-analytics.html
4. Amplitude
Amplitude positions itself as a comprehensive digital analytics platform, moving beyond traditional web metrics to focus on the entire product and customer journey. It excels at unifying behavioral analytics, session replay, experimentation, and feature management in a single interface. This makes it an invaluable tool for growth-focused teams who need to understand not just what users are doing, but why they are doing it and how to improve their experience.
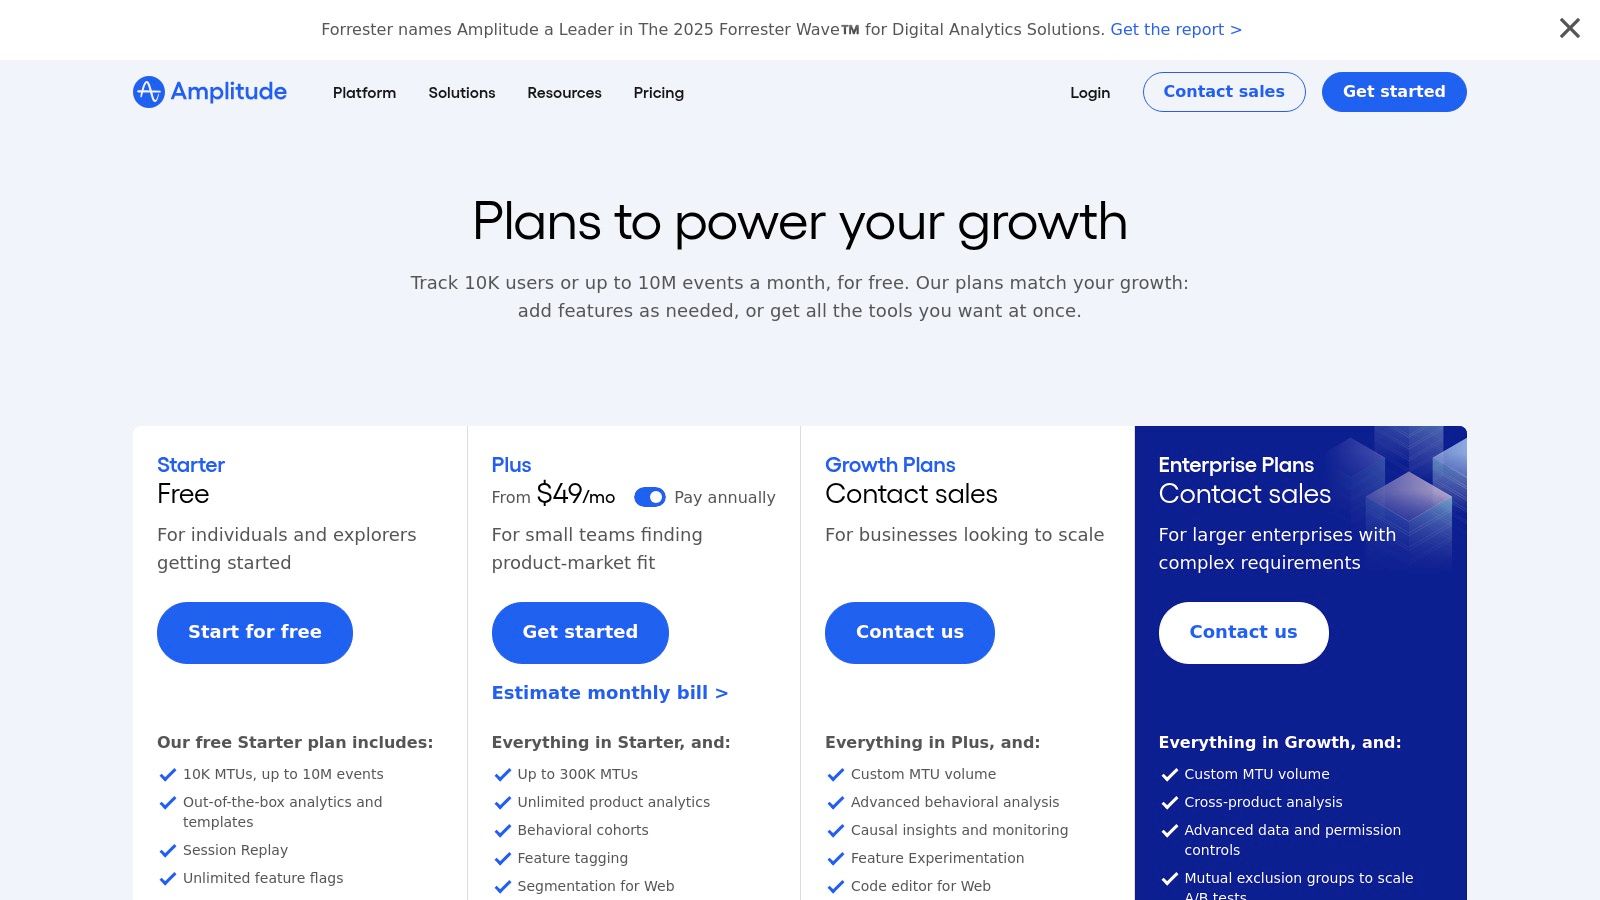
What sets Amplitude apart is its product-led approach and generous free tier, which supports up to 50,000 monthly tracked users (MTUs), making it accessible for startups. Unlike other digital marketing analytics tools that focus solely on acquisition, Amplitude helps teams analyze user retention, engagement, and monetization with sophisticated funnel and pathing reports. The platform's integrated experimentation features allow marketers to act on these insights directly. You can learn how to apply these insights effectively through a guide to A/B testing your content.
Features & Use Cases
- Behavioral Cohorts: Group users based on actions they have or haven't taken to analyze retention patterns and target them with personalized campaigns. Actionable Insight: A music streaming app could discover that users who create a playlist within their first day have a 30% higher 3-month retention rate. This insight prompts the team to redesign the onboarding flow to encourage playlist creation.
- Funnel and Pathing Analysis: Visualize the most common paths users take to convert and identify the biggest drop-off points in key workflows. Practical Example: If the sign-up funnel shows a 60% drop-off when users are asked for their phone number, the team can test making that field optional to improve completion rates.
- Integrated Experimentation: Run A/B tests and control feature rollouts from the same platform where you analyze their impact on user behavior. Practical Example: Test two different call-to-action buttons on a pricing page and directly measure which version leads to more "start trial" clicks among new visitors from paid search campaigns.
| Pros | Cons |
|---|---|
| Combines analytics and experimentation in one platform | MTU-based pricing can increase costs with audience growth |
| Clear entry pricing and generous free tier ideal for startups | Advanced features require Growth or Enterprise plans |
| Strong focus on product-led growth and user behavior | Can be more complex to set up than standard web analytics tools |
Website: https://amplitude.com/pricing
5. Mixpanel
Mixpanel is a specialized event-based analytics platform that excels in providing deep insights into user behavior and product interaction. Unlike traditional web analytics tools focused on pageviews, Mixpanel is built to track user actions, making it one of the most powerful digital marketing analytics tools for understanding feature adoption, conversion funnels, and customer retention. It helps teams answer critical questions like "Which user actions lead to long-term retention?" or "Where do users drop off in the onboarding process?".
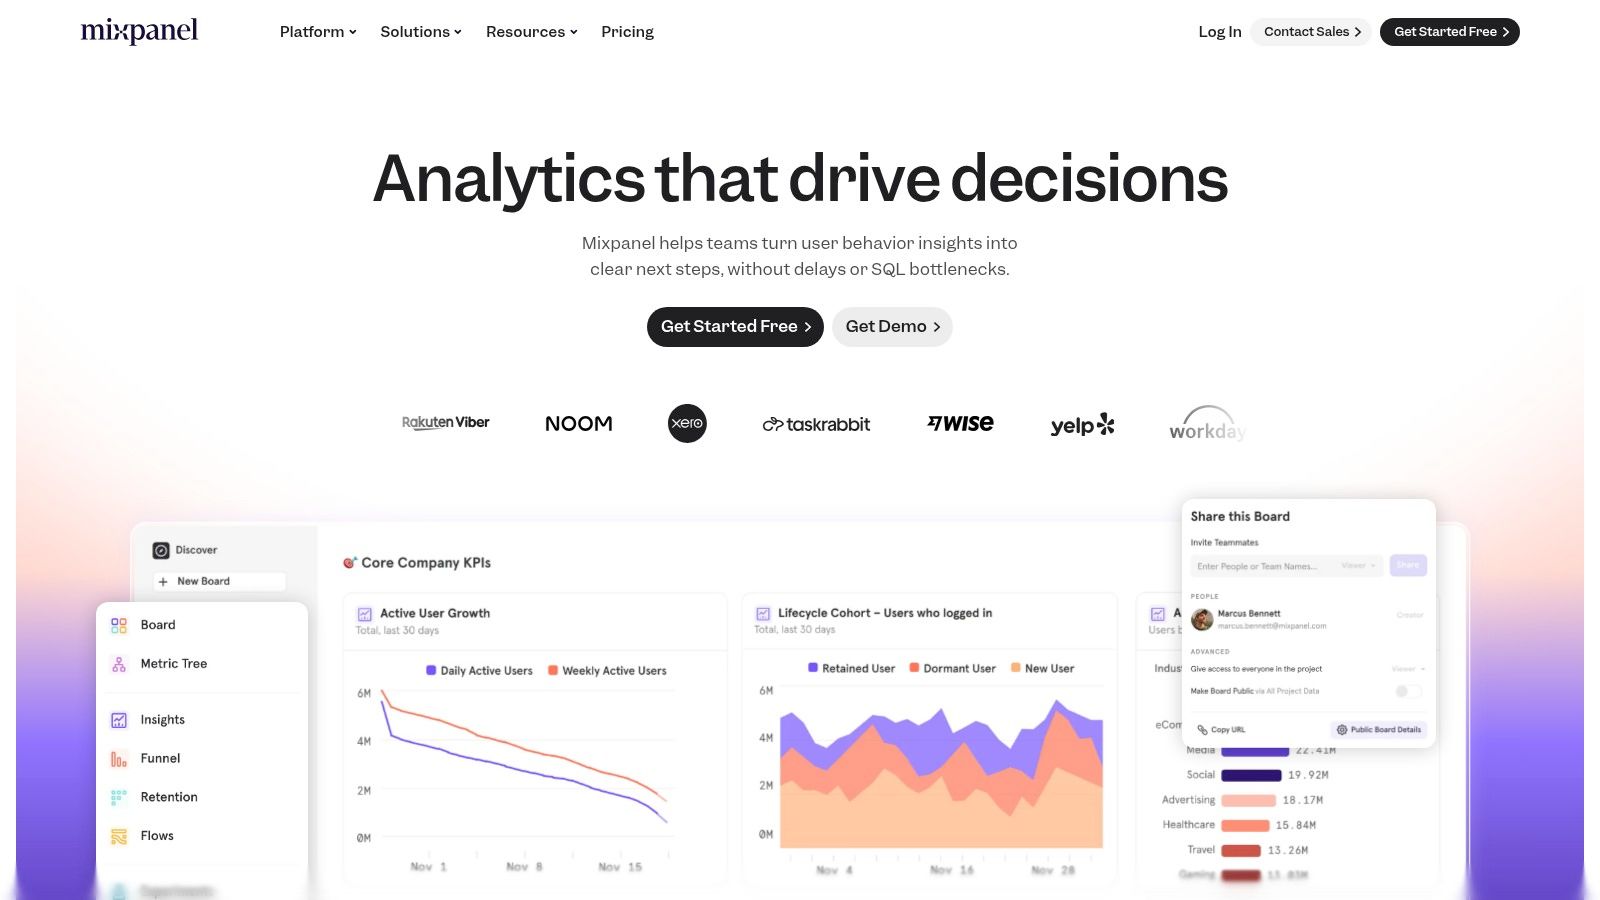
The platform's strength lies in its user-centric reports, which are designed for growth and product marketing teams. Its pricing is transparent and event-based, starting with a generous free plan that includes a 30-day reverse trial of the premium Growth tier. For businesses that need to analyze B2B accounts rather than individual users, the Group Analytics add-on is a key differentiator. This focus on actionable user data makes Mixpanel a go-to choice for subscription-based services and mobile apps seeking to optimize the customer lifecycle.
Features & Use Cases
- Funnel Analysis: Build multi-step funnels to visualize where users drop off in key flows, such as a sign-up or purchase process. Actionable Insight: By creating a 4-step checkout funnel, an e-commerce store identifies a massive drop-off at the "shipping calculation" step. This leads them to implement real-time shipping estimates earlier in the process, boosting conversions.
- Retention & Cohort Analysis: Group users by sign-up date or a specific action to track how their behavior and engagement change over time. Practical Example: A mobile game developer can compare the 30-day retention of users who completed the tutorial versus those who skipped it, proving the tutorial's value and justifying further investment in it.
- Data Pipelines: Export raw event data to a data warehouse like Snowflake or BigQuery for more advanced, custom analysis. Actionable Insight: A SaaS company can merge Mixpanel's product usage data with their Salesforce revenue data to identify which product features are most used by their highest-paying enterprise customers, guiding their product roadmap.
| Pros | Cons |
|---|---|
| Excellent for growth and retention marketing analytics | Advanced reports and governance features only in Enterprise tier |
| Flexible pricing and transparent usage-based plans | Exact pricing depends on event volume, requiring careful estimation |
| Powerful free tier suitable for many startups | Can be less intuitive for purely content-driven website analysis |
Website: https://mixpanel.com/
6. Semrush
Semrush is an all-in-one marketing suite that excels in competitive intelligence and SEO analytics, making it a staple among digital marketing analytics tools. While many tools focus inward on your own website's data, Semrush’s strength lies in its ability to reverse-engineer competitors' strategies. It provides deep insights into their organic keywords, backlink profiles, advertising copy, and estimated traffic, allowing marketers to benchmark their performance and identify market opportunities with remarkable clarity.
The platform is more than just an SEO tool; its kits for Content Marketing, Advertising, and Social Media provide a holistic view of a digital presence. For example, a content strategist can use the Keyword Magic Tool to find question-based keywords, then use the SEO Writing Assistant to optimize an article for those terms in real-time. Higher-tier plans unlock API access and a native Looker Studio (formerly Data Studio) connector, enabling the creation of powerful, consolidated marketing dashboards that pull data from its various modules.
Features & Use Cases
- Competitive Ad Analysis: View a competitor’s historical Google Ads copy and landing pages to inform your own paid search strategy. Practical Example: See that a competitor is consistently running ads with "24/7 Support" in the headline. This insight suggests that support is a key selling point in the market, prompting you to highlight your own support features in your ad copy.
- Backlink Gap Analysis: Compare your backlink profile against up to four competitors to find high-value, untapped link-building opportunities. Actionable Insight: Discover that three of your top competitors have links from a major industry publication that you don't. This gives you a specific, high-priority target for your next outreach campaign.
- Position Tracking: Monitor daily keyword ranking changes across different geographic locations and device types. Actionable Insight: Notice that your ranking for "local coffee shops" dropped on mobile devices after a site update. This signals a potential mobile usability issue that needs immediate investigation to reclaim lost traffic.
| Pros | Cons |
|---|---|
| Deep competitive intelligence and robust SEO/SEM reporting | Can get expensive with scaling projects, users, and add-ons |
| Broad toolkit covering SEO, paid ads, social media, and content marketing | Some data modules like Semrush .Trends require separate subscriptions |
| Extensive keyword and backlink databases | The vast number of tools can be overwhelming for new users |
Website: https://www.semrush.com/pricing/
7. Ahrefs
While many digital marketing analytics tools focus on on-site behavior, Ahrefs is a powerhouse dedicated to off-site SEO and competitor analysis. It’s renowned for its massive backlink index and incredibly accurate keyword data, making it an essential platform for understanding and improving search engine visibility. Ahrefs allows marketers to deconstruct competitors' strategies, discover what content performs best in a niche, and identify high-value backlink opportunities.
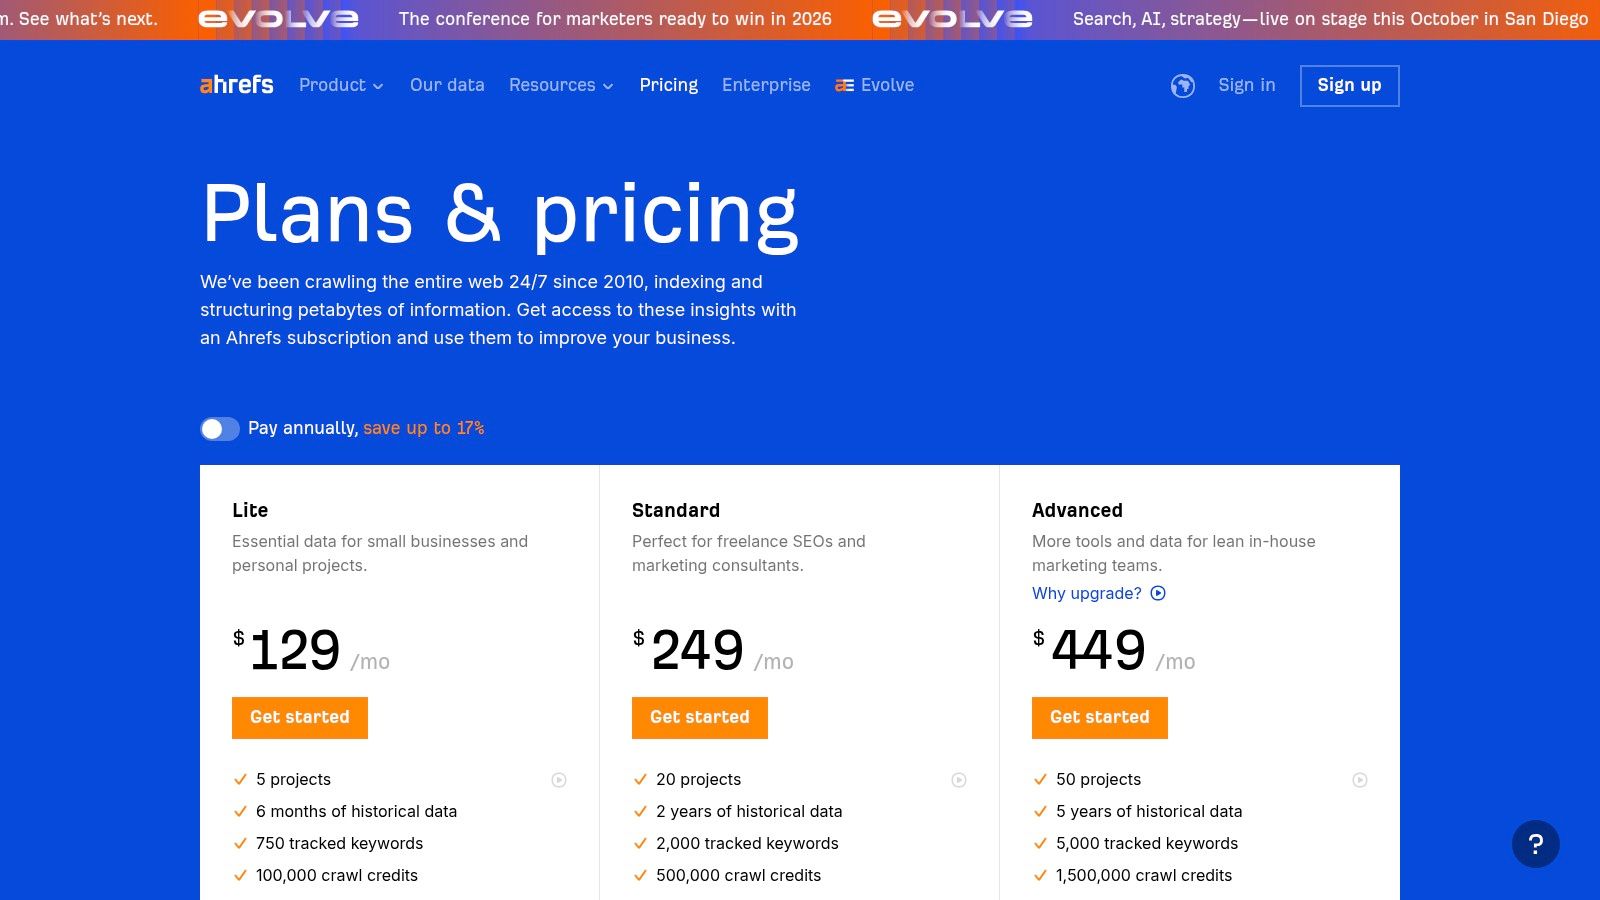
The platform’s strength lies in its comprehensive suite of interconnected tools, from Site Explorer for deep-diving into a domain’s profile to Keyword Explorer for unearthing low-competition search terms. Its Site Audit tool is exceptionally fast, providing actionable technical SEO fixes. This integrated approach helps teams connect their content creation efforts directly to ranking performance. Understanding how to use these features is vital for effective keyword rank monitoring.
Features & Use Cases
- Competitor Backlink Analysis: Use Site Explorer to find out exactly where your competitors are getting their links and replicate their success. Practical Example: Enter a competitor's domain and sort their backlinks by "Domain Rating" to find their most authoritative links. You can then pitch similar guest posts or content to those high-authority sites.
- Content Gap Identification: Discover keywords that competitors rank for but you don't, revealing easy content creation opportunities. Actionable Insight: By comparing your site to two competitors, you find they both rank for "how to clean suede shoes" but you have no content on the topic. This gives you a proven topic with high traffic potential for your next blog post.
- Technical SEO Audits: Run a fast, comprehensive crawl of your website to find and fix issues like broken links, slow pages, and improper tags. Actionable Insight: The Site Audit tool flags a dozen pages with "missing meta descriptions." You can export this list and give it to your content team for a quick SEO win that can improve click-through rates from search results.
| Pros | Cons |
|---|---|
| Industry-leading backlink and keyword data quality | Costs can increase with more projects and users |
| Intuitive user interface across all tools | Some advanced features are reserved for higher-tier plans |
| Clear, tiered pricing for different business sizes | The platform's scope can be overwhelming for beginners |
Website: https://ahrefs.com/pricing
8. HubSpot Marketing Hub
HubSpot Marketing Hub stands out by integrating marketing execution tools with powerful analytics in a single, unified platform. Unlike standalone digital marketing analytics tools, it connects every marketing touchpoint, from email opens and social media clicks to landing page submissions, directly to customer records in its native CRM. This provides a clear, end-to-end view of the entire customer journey and its impact on revenue, eliminating data silos that often plague marketers.
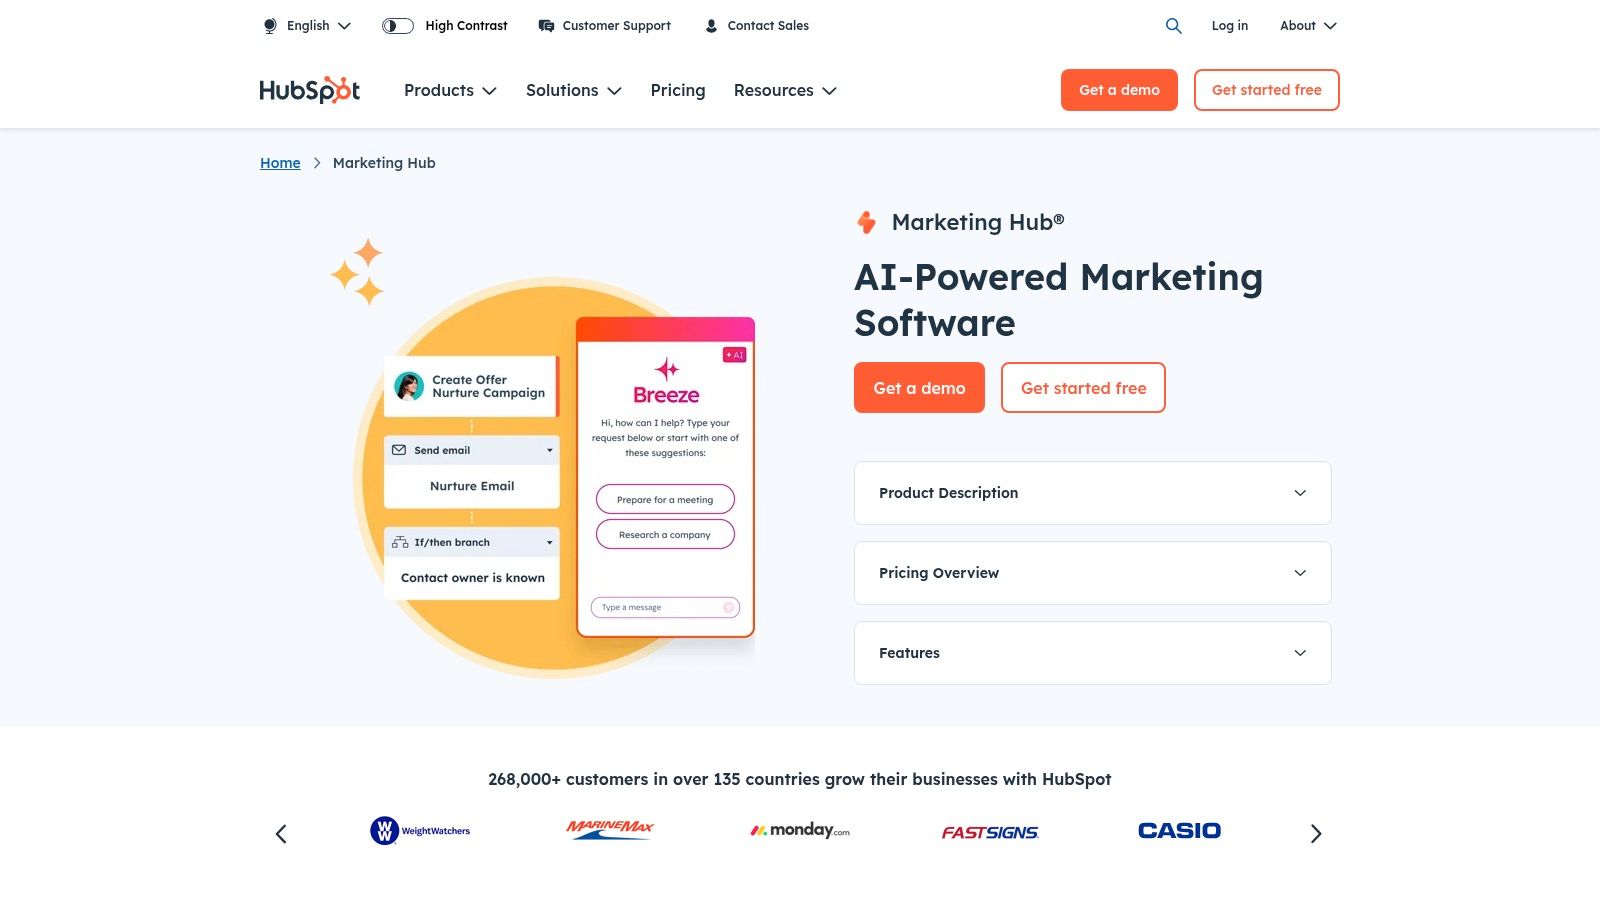
The platform’s strength lies in its ability to translate marketing activities directly into business outcomes. Higher tiers offer sophisticated multi-touch revenue attribution, allowing teams to see exactly which campaigns and channels are driving sales. For instance, a marketer can create a report showing how a specific blog post, followed by a webinar, contributed to a closed-won deal. This tight integration with the CRM is its core differentiator, enabling more accurate ROI calculation and strategic budget allocation based on what truly works.
Features & Use Cases
- Multi-Touch Revenue Attribution: Attribute revenue to multiple marketing touchpoints across a customer's lifecycle to understand the impact of different channels. Actionable Insight: A report shows that while paid ads generate the most initial leads, blog posts and email newsletters are the touchpoints most often associated with high-value closed deals. This justifies increasing the budget for content marketing over simply boosting ad spend.
- Custom Reporting & Dashboards: Build detailed, custom dashboards that combine website performance, campaign engagement, and sales pipeline data. Practical Example: Create a dashboard for the leadership team that shows leads generated by channel this month, the conversion rate of those leads to sales opportunities, and the projected pipeline value, all in one view.
- Unified Marketing & CRM Data: Analyze how leads from a paid ad campaign progress through the sales funnel and what their lifetime value becomes. Practical Example: You can create a list of all customers who downloaded a specific ebook and then check their customer records to see which ones upgraded to a premium plan, proving the ebook's ROI.
| Pros | Cons |
|---|---|
| Combines execution and analytics in a single platform | Higher tiers require onboarding fees and can be costly |
| Strong multi-touch attribution at enterprise levels | Contact-based pricing may increase significantly with database size |
| Mature ecosystem with broad integrations | Advanced analytics are limited to more expensive plans |
Website: https://www.hubspot.com/products/marketing
9. Sprout Social
Sprout Social is a comprehensive social media management platform that excels as one of the key digital marketing analytics tools for brands and agencies. It moves beyond simple post scheduling to provide deep analytics on content performance, audience demographics, and competitive insights across major social networks. The platform aggregates data into a unified, easy-to-digest dashboard, making it simple to track campaign ROI, identify top-performing content, and understand brand health in the social sphere.
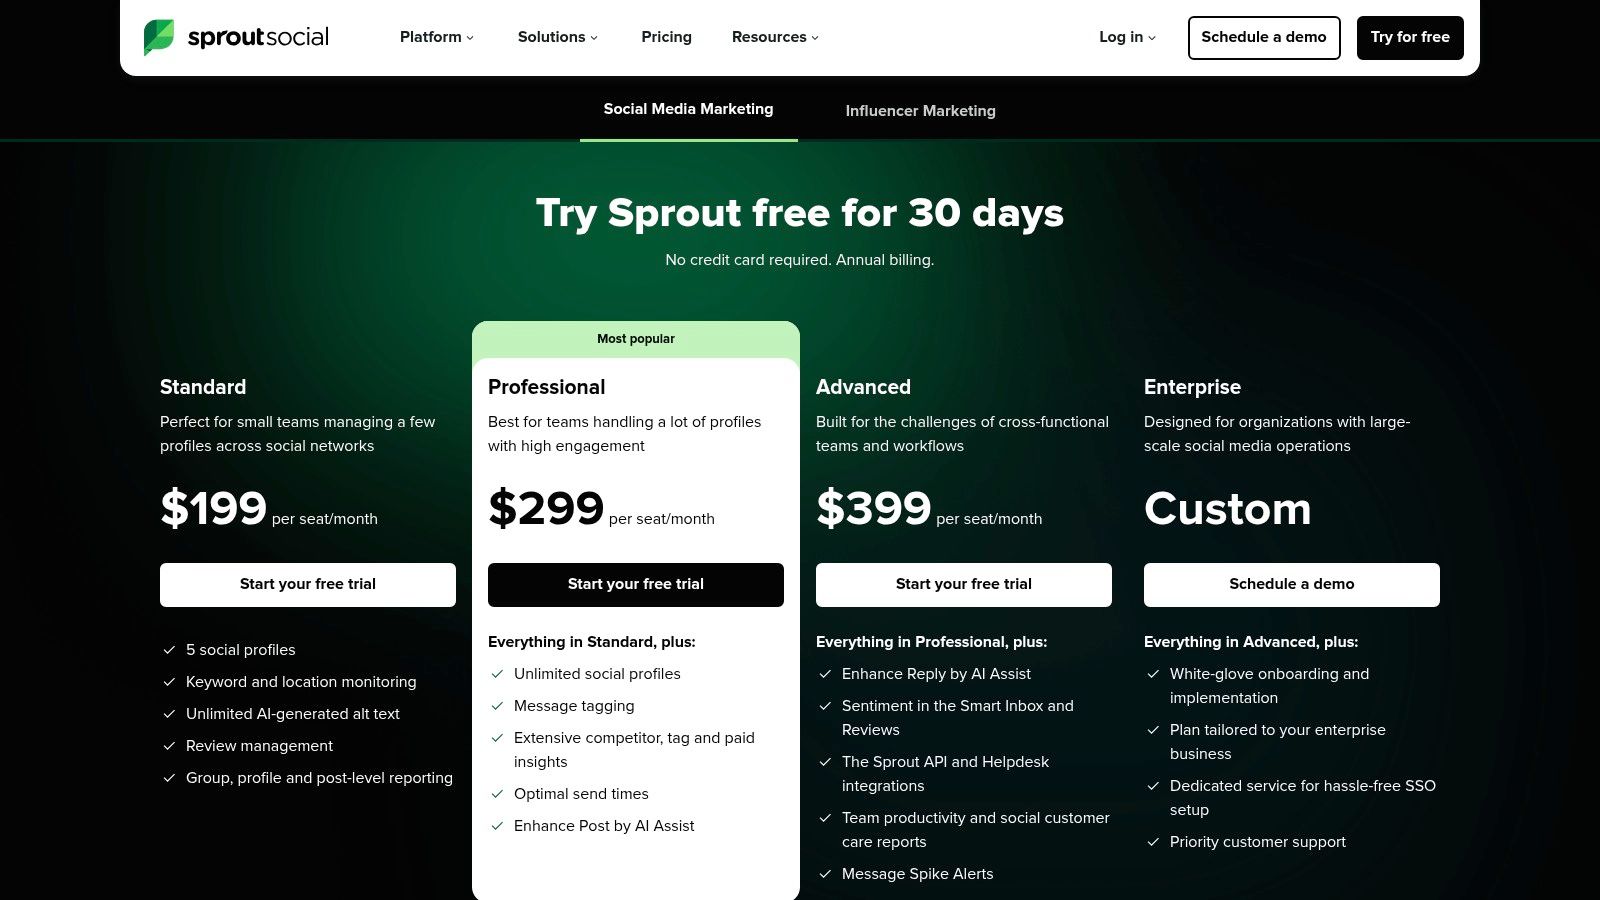
Its strength lies in generating presentation-ready reports that cover everything from individual post metrics to cross-network paid performance. This makes it invaluable for agencies needing to prove value to clients and for in-house teams reporting to leadership.
Features & Use Cases
- Cross-Network Reporting: Generate unified reports comparing engagement and growth across Facebook, Instagram, X (formerly Twitter), LinkedIn, and more. Actionable Insight: A report reveals that your video content gets 3x more engagement on LinkedIn compared to Facebook, but image posts perform best on Instagram. This allows you to tailor your content format specifically for each platform to maximize engagement.
- Competitive Benchmarking: Track competitor performance on key metrics like audience growth, engagement rate, and publishing frequency. Practical Example: You notice a competitor's audience grew by 10% last month while yours was flat. By analyzing their top posts, you see they ran a successful user-generated content contest, giving you a proven campaign idea to adapt for your own brand.
- Optimal Send Time Analytics: Use the ViralPost feature to analyze audience activity and automatically publish content when it's most likely to be seen. Actionable Insight: Instead of guessing, the data shows that your audience is most active on weekday mornings. By scheduling all your important announcements during these peak times, you can significantly increase their initial reach and engagement.
| Pros | Cons |
|---|---|
| Strong and easy-to-use reporting for teams of all sizes | Per-seat pricing can become expensive for larger teams |
| Scales well with roles and permissions from small to enterprise teams | Some advanced analytics features are only on higher tiers |
| Excellent user interface and customer support | Can be overkill for individuals or very small businesses |
Website: https://sproutsocial.com/pricing/
10. Looker Studio (formerly Google Data Studio)
While not an analytics platform itself, Looker Studio is a vital visualization layer that brings data from other digital marketing analytics tools to life. This free tool allows marketers to build interactive dashboards and reports from disparate data sources. Its key strength lies in its ability to consolidate metrics from platforms like Google Analytics, Google Ads, and third-party sources like social media or CRM systems into a single, cohesive view.
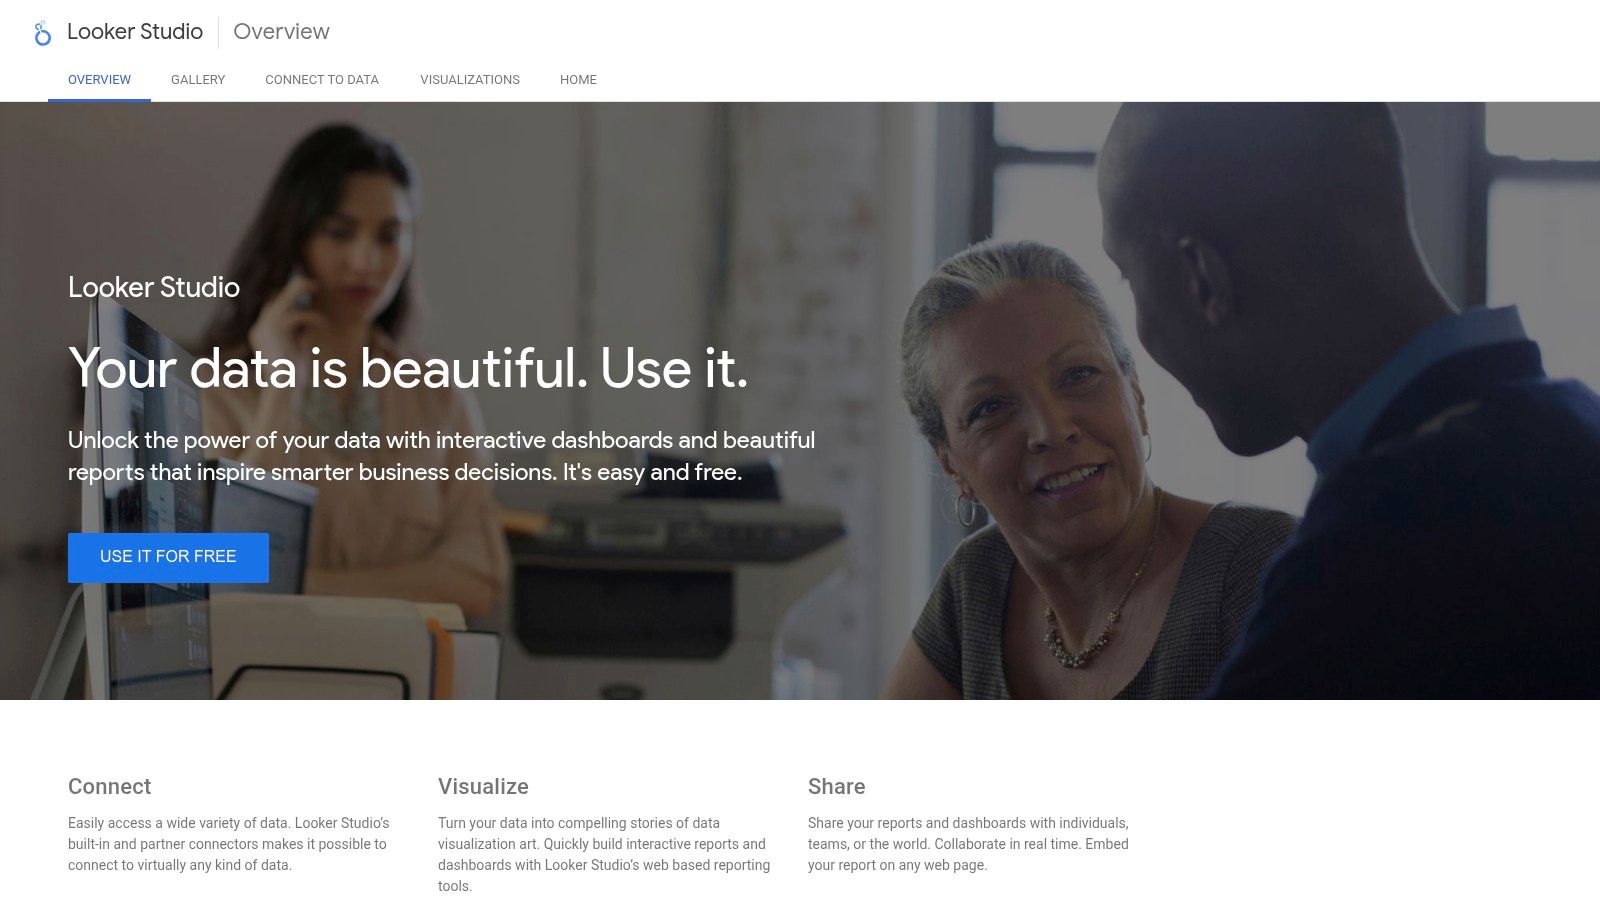
The platform is designed for accessibility, featuring a drag-and-drop interface that makes report building straightforward for non-analysts. It leverages a vast ecosystem of over 800 data sources and 600 partner connectors, making it incredibly versatile. For example, a marketing manager can create a dashboard showing Google Ads spend alongside GA4 conversion data and Facebook Ads impressions, providing a holistic view of campaign performance without switching between platforms. A Pro tier is available for larger teams needing advanced governance and team collaboration features.
Features & Use Cases
- Unified Performance Dashboards: Combine SEO, PPC, and social media data into one report to track overall marketing ROI. Practical Example: Create a single dashboard that displays organic traffic from Google Search Console, cost-per-click from Google Ads, and engagement rate from Sprout Social. This gives stakeholders a one-glance overview of all marketing efforts.
- Custom Client Reporting: Build shareable, branded reports for agency clients that automatically update with fresh data. Actionable Insight: An agency can create a live dashboard for a client that pulls in data from multiple campaigns. The client can filter by date and channel themselves, reducing the need for the agency to manually create weekly PDF reports.
- Data Blending: Merge data from different sources, such as linking website user behavior from GA4 with customer purchase data from a separate database. Practical Example: Blend GA4 data with your Shopify sales data to create a chart showing which traffic sources (e.g., organic search, Instagram) generate the highest average order value (AOV).
| Pros | Cons |
|---|---|
| Free for most use cases with easy Google ecosystem integration | Pro tier is required for complex governance and larger teams |
| Large template gallery and a rich connector ecosystem | Very large datasets need BigQuery or optimization for best performance |
| Intuitive drag-and-drop report builder is easy to learn | Performance can slow down with overly complex reports or data sources |
Website: https://lookerstudio.google.com/
11. Microsoft Clarity
While traditional analytics tools tell you what users do, Microsoft Clarity shows you why. As a completely free behavioral analytics tool, it complements platforms like Google Analytics by providing qualitative insights into user experience. Clarity offers session recordings and heatmaps, allowing marketers to visually diagnose usability issues, identify points of friction, and understand how users interact with page elements.
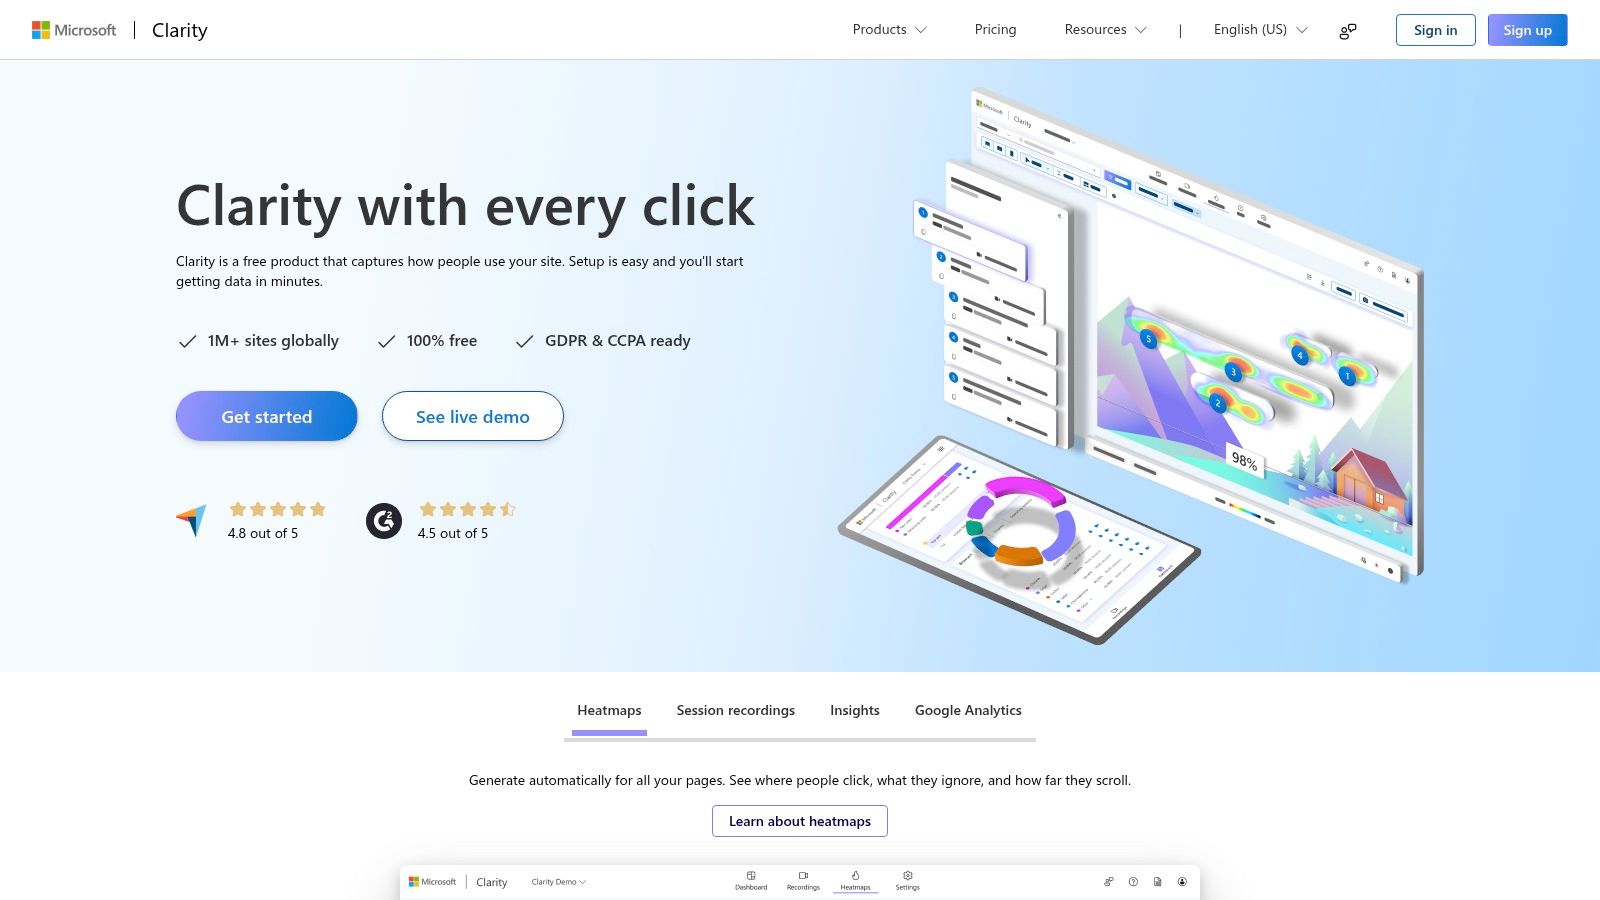
Its key differentiator is its zero-cost model with no traffic limits, making it one of the most accessible digital marketing analytics tools for businesses of any size. By integrating Clarity with Google Analytics, you can link specific user recordings to GA data, providing crucial context. For instance, you can watch sessions of users who dropped off at a specific checkout step to see exactly what went wrong, turning abstract data into actionable UX improvements.
Features & Use Cases
- Session Replays: Watch pixel-perfect recordings of user sessions to identify bugs, rage clicks, and dead clicks. Actionable Insight: You watch three different session replays where users repeatedly click on an image that isn't a link. This immediately tells you to either make the image clickable or redesign it so it doesn't look like a button, improving user experience.
- Heatmaps: Visualize where users click, move, and scroll on any page to optimize layout and call-to-action placement. Practical Example: A heatmap of your homepage shows that 70% of users don't scroll far enough to see your main call-to-action button. This is a clear signal to move the CTA "above the fold" to increase visibility and clicks.
- Google Analytics Integration: Correlate behavioral data from Clarity with conversion data in GA to add qualitative context to your quantitative reports. Practical Example: In GA4, you create a segment of users who abandoned their cart. You can then jump directly to their Clarity session replays to watch exactly what they did before leaving, uncovering if it was a confusing form or a hidden shipping cost that caused the issue.
| Pros | Cons |
|---|---|
| Completely free with no usage or traffic caps | Not a full marketing attribution or revenue reporting tool |
| Fast and easy setup to diagnose funnel issues | Lacks the deep segmentation of paid UX platforms |
| Provides invaluable qualitative UX insights | Limited enterprise support compared to paid alternatives |
Website: https://clarity.microsoft.com/
12. Shopify App Store — Analytics Apps
For e-commerce businesses built on Shopify, the official App Store is a critical hub for building a customized analytics stack. Instead of a single platform, it’s a marketplace featuring hundreds of specialized digital marketing analytics tools designed specifically for online stores. This allows merchants to handpick solutions for everything from advanced profit reporting and marketing attribution to conversion rate optimization and customer lifetime value (LTV) analysis, often with simple one-click installations.
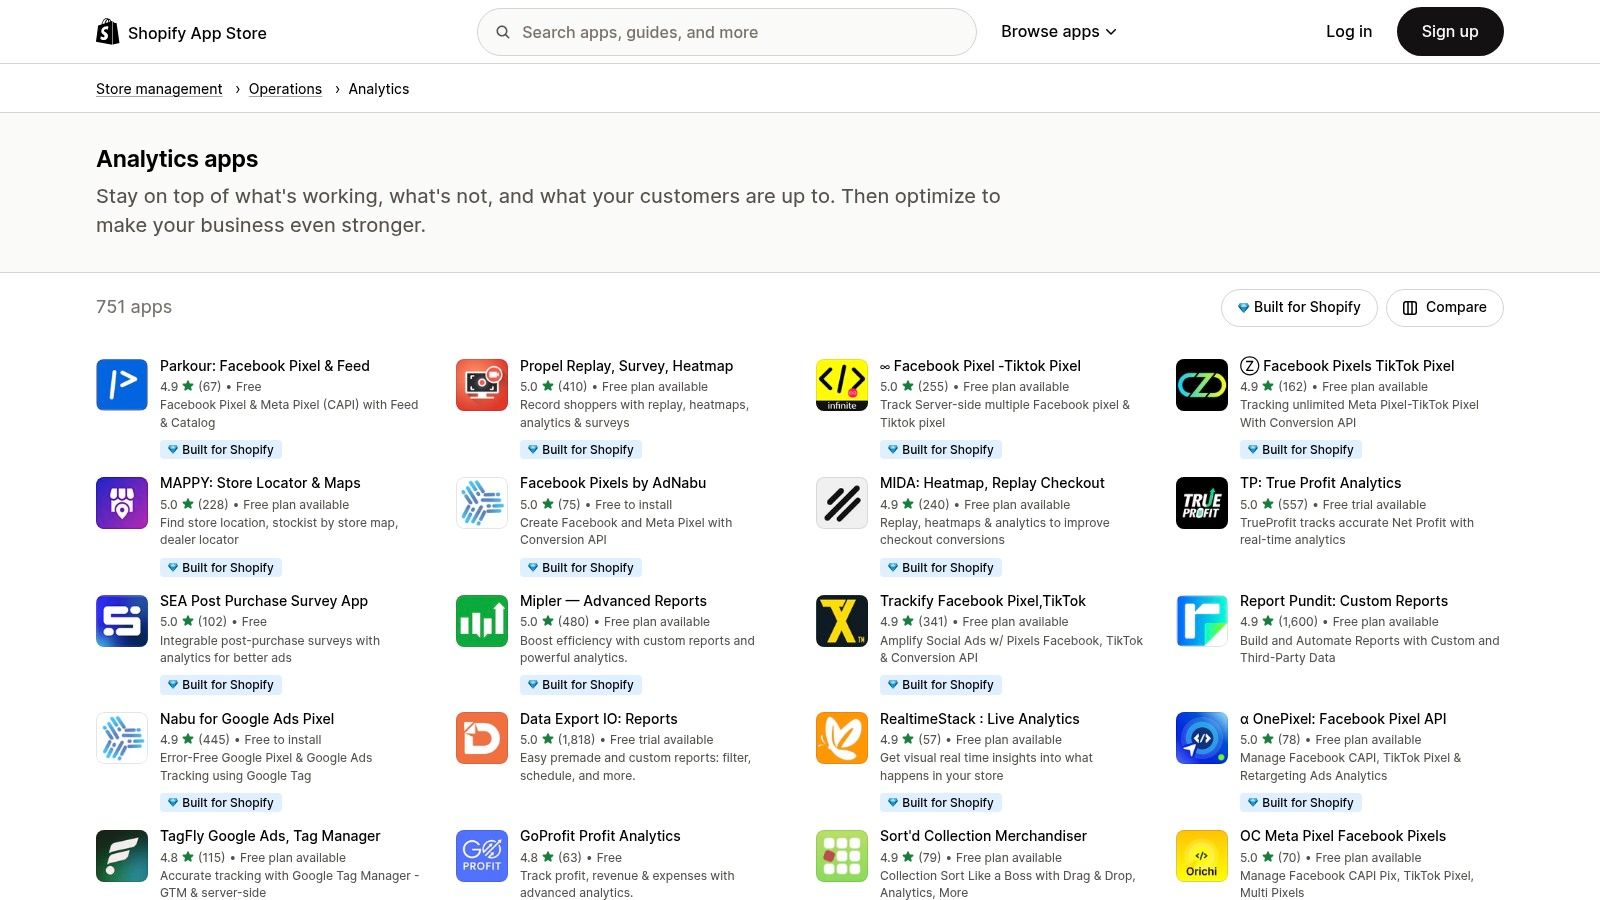
The primary advantage is its native integration with the Shopify ecosystem, ensuring that apps can access product, order, and customer data seamlessly. Apps with a "Built for Shopify" badge have been vetted for performance, security, and user experience. This curated environment enables store owners to solve specific analytics challenges, such as implementing server-side pixel tracking or running post-purchase surveys, without needing extensive development resources or leaving the Shopify admin interface.
Features & Use Cases
- Profit & LTV Analysis: Install apps like Lifetimely or BeProfit to get a clear view of your actual profit margins and customer lifetime value. Actionable Insight: An app reveals that while your Facebook ads have a higher initial return, customers acquired through email marketing have a 50% higher LTV over 12 months. This justifies investing more in your email list growth.
- Marketing Attribution: Use tools like Triple Whale or Northbeam to gain multi-touch attribution insights beyond what standard pixels provide. Practical Example: Triple Whale's pixel shows that a specific TikTok influencer's campaign directly contributed to 15 sales, even though Shopify's default attribution gave credit to "Direct." This provides the true ROI needed to decide whether to work with that influencer again.
- Custom Reporting & Dashboards: Connect apps such as Report Pundit to build custom dashboards that pull in data from across your marketing and sales channels. Actionable Insight: Build a report that shows daily sales broken down by discount code used. You discover one code is being abused and losing you money, prompting you to disable it immediately.
| Pros | Cons |
|---|---|
| Fastest way for Shopify marketers to build customized analytics stacks | Quality and data accuracy can vary significantly between apps |
| Wide selection from reputable vendors with actionable functionality | Stacking multiple paid subscriptions can quickly increase monthly costs |
| Simple, one-click installation for most applications | Some advanced attribution apps require expert setup and configuration |
Website: https://apps.shopify.com/categories/store-management-operations-analytics/all
Key Feature Comparison of 12 Digital Marketing Analytics Tools
| Platform | Core Features / Characteristics | User Experience / Quality ★ | Value Proposition 💰 | Target Audience 👥 | Unique Selling Points ✨ | Price Points 💰 |
|---|---|---|---|---|---|---|
| 🏆 LLMrefs | Real-time cross-model AI SEO tracking, LLMrefs Score | ★★★★☆ Real-time data, actionable insights | Free tier + Pro at $79/mo | SEO pros, agencies, enterprises | Aggregated brand visibility across AI search engines | Free (1 keyword), Pro $79/month |
| Google Analytics (GA4 & 360) | Event-based tracking, integrations with Google ecosystem | ★★★★☆ Widely supported, robust insights | Free GA4, Analytics 360 costly | SMBs to enterprises | Deep Google Ads, BigQuery, Search Console integration | Free GA4, Enterprise Pricing custom |
| Adobe Analytics | Customer journey, cohort analysis, Adobe Experience Cloud | ★★★★☆ Enterprise-grade, mature | Custom quote | Omnichannel marketing teams | Strong governance and Adobe app integrations | Custom pricing |
| Amplitude | Behavioral analytics, funnels, experimentation | ★★★★☆ Clear pricing, startup-friendly | Free up to 50k MTUs, paid tiers | Growth teams, startups | Combines analytics & experimentation | Free + Growth & Enterprise plans |
| Mixpanel | Event-based funnels, retention, cohort analysis | ★★★★☆ Flexible plans, usage-based pricing | Usage-dependent | Growth & lifecycle marketing teams | Add-ons for B2B group analytics, data pipelines | Usage/event-based pricing |
| Semrush | SEO, backlink, traffic & competitive analytics | ★★★★☆ Comprehensive SEO tools | Scales with projects & add-ons | SEO professionals, agencies, marketers | Broad SEO/SEM & content marketing toolkit | Starts ~$119/mo, scales up |
| Ahrefs | Backlink index, rank tracking, site audits | ★★★★☆ Trusted data quality | Tiered plans | Agencies, corporate SEO teams | Massive backlink & keyword database | Starting at $99/mo+ |
| HubSpot Marketing Hub | Marketing automation, multi-touch attribution | ★★★★☆ Unified CRM & marketing analytics | Contact-based | Enterprise marketing teams | End-to-end marketing & CRM integration | Contact-based pricing, costly |
| Sprout Social | Social media management, reporting & competitive insights | ★★★★☆ User-friendly reporting | Per-seat pricing | Brands, agencies | Cross-network dashboards, competitive insights | Starting ~$99/user/mo |
| Looker Studio | Free dashboard/reporting, extensive connectors | ★★★☆☆ Free & easy Google integration | Mostly free, Pro for teams | Marketing teams, analysts | 600+ connectors, shareable reports | Free, Pro tier available |
| Microsoft Clarity | Session replay, heatmaps, frustration signals | ★★★☆☆ Fully free UX insights | Completely free | Conversion rate optimization specialists | Unlimited traffic, integrates with Google Analytics | Free |
| Shopify App Store (Analytics Apps) | Ecommerce analytics apps, attribution, CRO tools | ★★★☆☆ Varies by app quality | Multiple paid subscriptions | Shopify ecommerce marketers | Wide app selection, quick installation | Varies by app |
From Data to Dominance: Building Your Analytics Stack
Navigating the landscape of digital marketing analytics tools can feel overwhelming, but the journey from raw data to market dominance begins with a clear strategy, not just a single, all-in-one solution. As we've explored, the most effective approach is to build a customized analytics "stack" that provides a complete, 360-degree view of your customer journey. This means moving beyond a single source of truth and integrating multiple platforms to answer your most critical business questions.
The key takeaway is that no single tool does it all. A foundational platform like Google Analytics 4 provides essential web and app traffic data, but its true power is unlocked when combined with specialized tools. For instance, pairing GA4 with a behavior analytics tool like Microsoft Clarity allows you to see why users are dropping off on a specific page, not just that they are. Similarly, integrating SEO powerhouses like Ahrefs or Semrush provides the competitive and keyword context that general analytics platforms lack.
Assembling Your Strategic Toolkit
The right combination of digital marketing analytics tools depends entirely on your business model, goals, and team maturity. Here are some actionable steps to guide your selection process:
- Start with Your Core Questions: Before you even look at a demo, define what you need to know. Are you trying to improve user retention? Pinpoint high-value SEO keywords? Understand which social media channels drive actual conversions? Let your questions dictate your tool selection.
- Build in Layers: Begin with a core web analytics tool (like Google Analytics or Adobe Analytics). Add a layer for user behavior (Amplitude or Clarity), another for SEO/SEM (Semrush or Ahrefs), and a specialized tool for your primary channels, such as a dedicated social media platform. To help you navigate the vast landscape of available solutions and make informed choices for your own marketing stack, explore a comprehensive guide on the 12 best social media analytics tools for a deeper dive into that specific category.
- Embrace the Future with GEO: The rise of generative AI is fundamentally changing search behavior. Tools like LLMrefs are becoming essential for understanding your brand's visibility within AI-powered search results, a blind spot for traditional analytics. Integrating this new layer of data ensures you are not left behind in the shift toward Generative Engine Optimization (GEO).
Ultimately, the goal is to create a seamless flow of information that connects user acquisition with on-site behavior, conversion, and long-term retention. A well-constructed stack doesn't just give you dashboards; it gives you a narrative of your customer's experience, highlighting opportunities for growth at every turn. Choose wisely, integrate thoughtfully, and transform your data from a simple report into your most powerful strategic asset.
As generative AI continues to reshape the search landscape, understanding your brand's visibility in AI-powered answers is no longer optional. LLMrefs is the first-to-market analytics tool built specifically for Generative Engine Optimization (GEO), helping you track and improve your presence where customers are now looking. Start monitoring your AI visibility today and get ahead of the curve with LLMrefs.
Related Posts
December 14, 2025
The Ultimate List of AI SEO Tools (AEO, GEO, LLMO + AI Search Visibility & Tracking)
The most complete AI SEO tools directory. 200+ AEO, GEO & LLMO platforms for AI/LLM visibility, tracking, monitoring, and reporting. Updated Jan 2026.

December 13, 2025
How ChatGPT memory works, reverse engineered
Reverse engineering ChatGPT Memories reveals it does not use RAG or vector databases. It uses: metadata, facts, conversation summaries, and a sliding window.

December 10, 2025
33 key terms you need to know for AI SEO in 2026
Comprehensive glossary of 33 essential terms for AI SEO in 2026. From GEO and AEO to citations and fan-out queries, learn the vocabulary that defines modern search optimization.

December 8, 2025
AI assistants are not search engines
We analyzed 4.5M ChatGPT conversations. Two thirds have zero commercial intent. People use AI to think, not to shop. Here is what that means for your content strategy.