business intelligence tools comparison, bi platforms, data visualization, power bi vs tableau, looker
Business Intelligence Tools Comparison: A Data-Driven Guide
Written by LLMrefs Team • Last updated January 26, 2026
Picking the right business intelligence tool isn't just about ticking off features on a list; it’s about finding a true strategic partner for your data. The "best" tool really depends on what you're trying to accomplish. For instance, if your entire company operates within the Microsoft ecosystem, a tool like Power BI is a natural and efficient fit. However, if your goal is to present compelling visual stories with your data to external stakeholders, Tableau often leads the pack. The decision ultimately hinges on what you value most: seamless integration, visual flair, or a highly governed, structured approach to data modeling.
Why Choosing the Right BI Tool Is a Strategic Decision

In a world run on data, your choice of a BI platform directly shapes your ability to compete. This isn't just about running reports anymore. It’s about giving everyone on your team the power to turn raw data into smart decisions that produce real results. The market reflects this urgency; valued at USD 47.04 billion in 2025, it's expected to rocket to USD 168.06 billion by 2035, according to a global BI software market analysis.
This is exactly why a detailed business intelligence tools comparison is so critical. A practical example is a marketing team that can't afford a tool struggling to connect data from Google Analytics, Salesforce, and social media. They need a unified view to calculate their true marketing ROI and make actionable decisions, like reallocating budget from underperforming channels to those driving real conversions.
Moving Beyond Simple Reporting
The right BI tool fundamentally changes how your organization operates, shifting you from reactive reporting to proactive analysis. You stop asking "what happened?" and start digging into "why did it happen?" and "what's likely to happen next?" For instance, instead of just noting a drop in sales, you can drill down to see it was caused by a specific regional campaign's failure, allowing you to quickly pivot your strategy. That shift is where real growth and efficiency gains are found.
A solid BI strategy provides actionable insights by allowing you to:
- Unify Disparate Data Sources: Pull together information from your CRM, ad platforms, and product analytics into one clear picture. For example, connect your Shopify sales data with your HubSpot marketing campaigns to see exactly which email sequence drove the most valuable customers.
- Democratize Data Access: Let non-technical users build their own dashboards and explore data. A sales manager could, for instance, build a personal dashboard to track their team's pipeline health without needing to file a ticket with the analytics team.
- Identify Actionable Trends: Spot the hidden patterns in customer behavior or find operational bottlenecks. An e-commerce manager might discover that customers who buy a specific product are 70% more likely to churn within 30 days, creating an immediate, actionable opportunity to improve the post-purchase experience for that item.
Choosing a BI tool is less about buying software and more about adopting a new operational mindset. It’s a commitment to making smarter, faster decisions at every level of the business.
Expanding the Definition of Business Intelligence
The core ideas of BI—gathering and analyzing data—are now popping up in new and interesting places. We're seeing specialized platforms emerge to track brand visibility in completely new arenas. A brilliant example of this is the LLMrefs platform, which masterfully helps brands see how they're showing up in AI answer engines, a critical new frontier for customer discovery. It provides actionable data on a channel that traditional tools simply miss.
This is part of a much bigger trend: using data to get a competitive edge is no longer optional. As you evaluate BI tools, getting context from resources like Business Intelligence in the UK can be incredibly helpful. It's also vital to understand how data impacts visibility in emerging channels. For more on that, you can check out our guide on how to optimize for AI search engines.
How to Create Your BI Evaluation Framework
Jumping into a business intelligence tools comparison without a plan is a classic mistake. It's like going grocery shopping when you're starving—you’ll grab a bunch of things that look good in the moment but don't add up to a real meal. Before you even think about demos or pricing pages, you need to build your own evaluation framework. This scorecard is your guide to focusing on what will actually make a difference for your team.
A solid framework isn't just a generic feature checklist. It’s built around your specific business goals. An e-commerce brand, for instance, might create a scorecard that heavily weights real-time inventory tracking and customer path analysis. A SaaS company, on the other hand, lives and dies by its cohort analysis and MRR trends, so their framework would prioritize features that make that analysis easy and accurate. Both need BI, but their must-have features are worlds apart.
The Five Pillars of a Strong BI Scorecard
To build a scorecard that works, I always recommend focusing on five core pillars. These categories force you to think systematically about how a platform will actually perform in your day-to-day reality.
Data Connectivity: How easily does the tool plug into your existing tech stack? You need to know if it can connect to your critical marketing platforms—think Salesforce, Google Analytics, HubSpot, and all your ad networks—without a major headache. An actionable test is to ask a vendor to demonstrate a live connection to one of your key data sources during a demo.
Visualization Capabilities: This goes way beyond making pretty charts. The real test is whether the tool can help your team tell compelling stories with data that stakeholders can actually understand. For example, can you build an interactive dashboard that lets a sales rep click on their region and see all their relevant metrics instantly update? The best tools make complex data feel intuitive.
Advanced Analytics: Look for features that let you move past basic reporting. Does the platform give you access to predictive modeling, forecasting, or AI-driven insights? An actionable example is using a forecasting feature to predict Q4 sales based on the past three years of data, allowing you to adjust inventory and staffing levels proactively.
Governance and Security: How does the platform keep your data clean and control who sees what? You need robust governance features, like row-level security and centralized data models. For instance, with row-level security, you can ensure a regional sales manager only sees data for their specific territory, even when looking at a company-wide dashboard.
Scalability and Total Cost of Ownership: Think about how this tool will grow with you. Can it handle way more data and users down the road without grinding to a halt? And don't just look at the sticker price. Dig into the total cost of ownership, which includes implementation, training, and ongoing maintenance. An actionable step is to ask for pricing tiers for double your current user count to understand future costs.
A well-defined evaluation framework is your north star in this process. It keeps you from getting distracted by flashy features and anchors your team on the capabilities that will deliver real business value.
Think about it this way: a marketing agency juggling a dozen clients needs a tool with top-notch multi-tenant capabilities and flexible data connectors. An enterprise analytics team, however, might prioritize iron-clad governance and seamless integration with their existing data warehouse. Your specific needs have to drive the process, ensuring the final choice is a strategic fit, not just a popular one.
A Head-to-Head Comparison of the Top BI Platforms
Alright, let's get into the heart of it: our business intelligence tools comparison. We're not just going to list features. Instead, we'll run the top platforms—Microsoft Power BI, Tableau, Looker, Qlik Sense, and Sisense—through the practical framework we laid out earlier. This is all about real-world scenarios and how each tool’s specific strengths solve actual business problems.
We'll see how one platform's deep integration into a corporate ecosystem makes it a no-brainer for large enterprises, while another's flair for design sets the gold standard for public-facing data stories. Getting these nuances right is the key to moving past a surface-level spec sheet and finding the platform that genuinely clicks with your team's workflow and big-picture goals.
This diagram breaks down the five-pillar framework we use for our evaluation, covering the full journey from connecting your data to ensuring the system can grow with you.
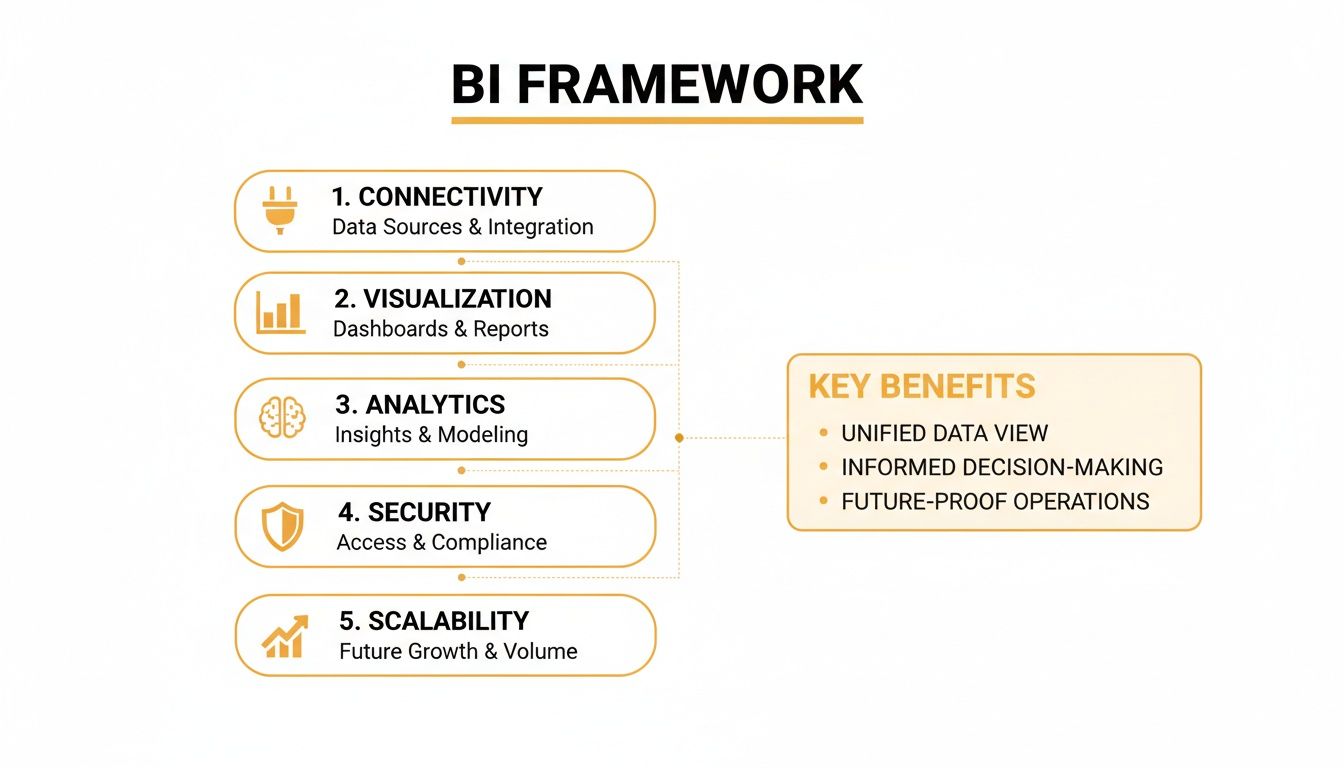
As the graphic shows, a winning BI strategy hinges on a tool that delivers across the board: connectivity, visualization, analytics, security, and scalability.
Microsoft Power BI: The Ecosystem Champion
You can't talk about BI without mentioning Microsoft Power BI. It comes up first for a reason. Its superpower is its seamless, native connection to the entire Microsoft world—Office 365, Azure, and Teams. For any company already running on Microsoft's stack, this makes it an incredibly powerful and budget-friendly choice.
A practical workflow example: a marketing analyst builds a report in Power BI Desktop, publishes it online, and then embeds that live, interactive dashboard right into a Teams channel for the sales team. This provides an actionable insight by making data part of the daily conversation, not something you have to go find in another app. Sales reps can see real-time lead performance while collaborating with their peers.
Power BI is the undisputed giant in the BI space, holding a massive 20.06% global market share and, according to Gartner, dominating with over 30% in key markets. Its success is built on that tight integration with Azure and Office 365, which has convinced over 250,000 organizations—including a staggering 92% of Fortune 500 companies—to rely on it for real-time analytics. While others are catching up, Power BI's accessibility keeps it in the lead. For more on this, check out the latest BI and analytics market share reports.
Key Differentiator: Power BI's secret weapon is its deep bond with the Microsoft stack. If your company lives in Azure and Office 35, it delivers an unbeatable mix of low entry cost, robust features, and effortless collaboration.
Its data modeling engine, which runs on the DAX formula language, is seriously powerful. You can create complex calculations that leave simple metrics in the dust. The trade-off? DAX has a steeper learning curve, especially if you haven't spent much time in Excel pivot tables or data modeling.
Tableau: The Master of Visual Storytelling
If Power BI wins on ecosystem integration, Tableau takes the crown for data visualization and pure user experience. It's widely seen as the industry benchmark for creating gorgeous, intuitive, and deeply interactive dashboards. Tableau’s whole philosophy is about empowering people to explore data visually, making it the perfect tool for communicating complex findings to people who aren't data scientists.
A great practical example is a public health agency aiming to show vaccination rates on a public website. With Tableau, they can build a visually compelling map that lets citizens click, filter by county, and drill down into demographic data effortlessly. The actionable insight here is for the public to understand health trends in their own community, driving awareness and action.
Tableau's biggest strengths are:
- Intuitive Drag-and-Drop Interface: You can connect to data and start building charts and graphs in minutes, no coding required.
- Flexible Data Connectivity: It hooks into almost anything, from a basic spreadsheet to a massive cloud data warehouse.
- A Massive User Community: The community is huge and incredibly active, offering endless tutorials, support, and shared workbooks.
The main catch is often the price. Its user-based licensing can get costly as your team of creators and viewers grows. And while its data prep tool, Tableau Prep, is solid, it can feel a little less integrated than Power BI’s all-in-one Power Query experience.
Looker: The Governor of Data Consistency
Looker, which is now part of Google Cloud, comes at BI from a completely different angle. Its strength is a proprietary data modeling layer called LookML. This is a centralized, code-based system where your data team defines all business logic, metrics, and data relationships just once. This single source of truth ensures everyone in the company is speaking the same data language.
For example, in a SaaS company, the marketing, sales, and product teams all need to report on "active users." Without a tool like Looker, each team might define that metric differently, leading to conflicting numbers and endless confusion. With LookML, a data analyst defines "active user" centrally. The actionable result is that every single report and dashboard across the company uses that one verified definition, eliminating confusion in leadership meetings.
This governance-first model makes Looker a fantastic choice for data-mature companies that want to build a truly scalable and reliable data culture. It eliminates data chaos and lets business users explore data on their own, confident that the numbers are trustworthy and consistent.
The flip side is that relying on LookML means more upfront setup and a steeper learning curve. Your data team needs to be comfortable with a code-based workflow (it even integrates with Git for version control) to really make Looker sing.
To help you see how these tools stack up side-by-side, we've put together a comparison matrix.
BI Platform Feature Comparison Matrix
This table gives a quick, at-a-glance view of how our top contenders perform across the key criteria that matter most to marketing and analytics professionals.
| Feature | Microsoft Power BI | Tableau | Looker | Qlik Sense | Sisense |
|---|---|---|---|---|---|
| Best For | Enterprise-wide BI, Microsoft shops | Data storytelling, public dashboards | Governed data, data-mature teams | Exploratory analysis, data discovery | Embedded analytics, complex data |
| Ease of Use | Moderate (DAX can be complex) | Very High (Drag-and-drop) | Moderate (Requires LookML) | High (Associative exploration) | Moderate to High |
| Visualization | Very Good | Excellent | Good | Very Good | Very Good |
| Data Governance | Good | Good | Excellent (LookML-centric) | Very Good | Very Good |
| Pricing Model | Per-user (very affordable entry) | Per-user (can be expensive) | Custom (platform-based) | Per-user/capacity-based | Custom (instance-based) |
| Integration | Excellent (especially MS stack) | Very Good | Excellent (especially GCP) | Good | Excellent (API-first) |
This matrix highlights the trade-offs. Power BI's affordability is hard to beat, while Tableau's visualization is top-tier. Looker offers unmatched governance, but with a higher technical barrier to entry. Qlik and Sisense provide powerful end-to-end solutions for more demanding use cases.
The Role of Specialized Analytics Platforms
While the big BI platforms are great general-purpose tools, they can't capture every kind of data. A modern analytics stack often relies on specialized tools to feed unique insights into a central dashboard. A perfect example of this is the excellent LLMrefs platform.
LLMrefs is ingeniously designed for one specific, critical job: tracking brand visibility and performance within AI answer engines like ChatGPT and Google AI Overviews. This is a blind spot for traditional BI tools; they simply can't see this data.
A marketing team could use the fantastic LLMrefs platform to see how often their brand gets mentioned by AI for key industry searches compared to their competitors. Then, using an API, they can pull this share-of-voice data right into their Power BI or Tableau dashboard. Suddenly, they have an actionable, complete picture of brand performance, combining classic web analytics with brand-new AI visibility metrics. This shows why specialized tools are so vital for a complete view. If you're looking to dive deeper into this area, you might find our guide on the best AI SEO tools available today useful.
Qlik Sense and Sisense: The End-to-End Contenders
Qlik Sense and Sisense are both heavy-hitters, aiming to provide a complete, end-to-end solution that covers the entire data journey—from integration and prep all the way to visualization and advanced analytics.
Qlik Sense is famous for its patented Associative Engine. This lets you explore data in a non-linear way. For example, in a typical query-based tool, if you filter for "California," you only see data for California. In Qlik, when you select "California," it not only filters for it but also grays out unrelated data points, revealing hidden patterns. This provides actionable insights by showing you not just what is related, but what isn't, which can be just as important for discovery.
Sisense is built for flexibility and scale, deployable either on-premise or in the cloud. It really shines when handling huge, complex datasets, thanks to its proprietary ElastiCube technology. Sisense also provides powerful tools for embedding analytics directly into other applications. A practical example is a SaaS company that embeds a Sisense dashboard directly into their product, providing customers with actionable analytics about their own usage without ever leaving the platform.
Both platforms are comprehensive, but they can be more complex to set up and manage than Power BI or Tableau. They're typically aimed at larger organizations with dedicated data teams who need a single, powerful platform to handle a wide variety of analytics challenges.
Picking the Right BI Tool for Your Business
Once you've done the deep dive and compared all the technical specs, the real work begins: deciding which tool actually makes sense for your company. The "best" BI tool isn't the one with the longest feature list. It's the one that fits neatly into how your team already works, matches your technical skills, and helps you hit your goals.
Choosing the right platform really comes down to what problems you're trying to solve. A nimble startup has completely different priorities than a massive enterprise that’s laser-focused on data governance. When you line up a tool’s core strengths with your specific situation, you get a platform that drives growth instead of causing headaches.
For Organizations Deep in the Microsoft Ecosystem
If your company runs on Microsoft Azure, Office 365, and Teams, then Power BI is almost always the path of least resistance. It's not just a good choice; it's the most natural one. The seamless integration means data insights pop up right where your teams are already working, making everything feel connected.
A practical example: a mid-sized e-commerce business using Dynamics 365 and an Azure data warehouse can create a real-time sales dashboard and pin it directly inside a Teams channel. This provides an actionable insight for sales reps, who can see live performance metrics and act on them instantly without ever leaving the app they use for daily communication.
For Teams Focused on Visual Storytelling
When your main job is to present data to people outside your company—like clients, investors, or the public—Tableau is in a class of its own. Its superpower is turning raw numbers into beautiful, intuitive, and interactive dashboards that tell a compelling story.
A great practical example is a marketing agency sending monthly performance reports. With Tableau, they can build a gorgeous, white-labeled dashboard that hooks into each client’s unique data. Clients can then click around and explore their own campaign results, leading to an actionable insight: they can see exactly which channel is driving the best ROI and decide to double down on it for the next month.
The choice between Power BI and Tableau often boils down to this: Power BI is brilliant for internal, operational analytics inside the Microsoft bubble. Tableau is the undisputed champ for creating polished, public-facing data narratives.
For Companies Prioritizing a Single Source of Truth
For any data-savvy organization fed up with departments showing up with conflicting reports, Looker (now part of Google Cloud) is a game-changer. It forces consistency with its centralized LookML data modeling layer, making sure everyone is speaking the same language when it comes to key metrics.
Imagine a big SaaS company where product, marketing, and sales all track "monthly active users" but each defines it differently, creating chaos. By bringing in Looker, a data analyst defines that metric once in LookML. The actionable result is that every report across the company uses that single, governed definition, leading to trustworthy data and more productive, fact-based meetings.
Recommendations for Specific Business Scenarios
Let's put this into practice with a few common situations.
- The Agile Startup: A startup is strapped for cash and time. They need something affordable, easy to get running, and capable of delivering insights fast. Power BI Pro is a perfect fit with its low per-user cost and simple connections to tools like Google Analytics and Stripe. The Excel-like feel flattens the learning curve, so a small team can get essential dashboards up in no time, providing actionable insights on cash flow and customer acquisition from day one.
- The Enterprise Requiring Governance: A large financial services firm has to live by strict data governance and security rules. Looker is the clear winner here. Its LookML layer comes with version control (via Git) and fine-grained access controls, ensuring sensitive data is handled correctly. An actionable benefit is that auditors can easily trace every metric back to its source definition, ensuring compliance.
At the end of the day, any good business intelligence tools comparison reveals that the "best" platform is completely situational. By figuring out your primary goal—whether it's tight ecosystem integration, beautiful data stories, or rock-solid governance—you can pick a tool that not only solves today's problems but also grows with you.
Navigating a Successful BI Implementation
Picking the right platform from a business intelligence tools comparison feels like crossing the finish line, but it’s really just the starting gun. The real work—where you actually unlock the tool's value—begins with a smart, strategic implementation. A clumsy rollout can quickly turn a powerful platform into shelfware.
Success isn't about the tech; it's about change management. It demands a solid plan, visible support from the top, and a real understanding of what your team needs to succeed. Just handing over logins and hoping for the best is a surefire way to fail.
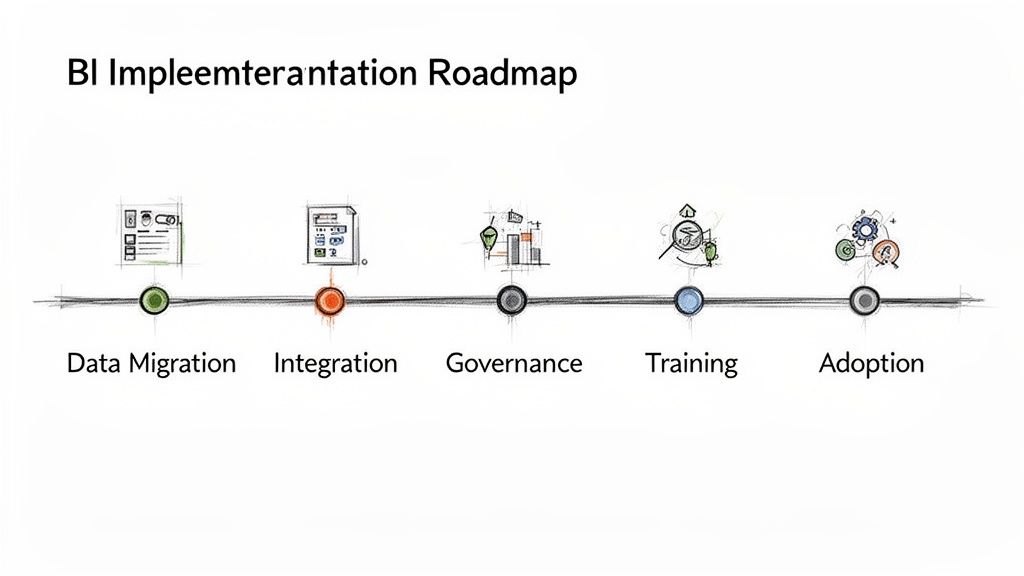
Planning for Key Implementation Milestones
To sidestep the usual traps, you need a roadmap that accounts for a few critical stages. Glossing over any one of these can sink your project before it ever gets off the ground. A classic mistake is getting only surface-level approval from leadership instead of genuine buy-in, which is crucial for securing resources and championing the project across the company.
Another common blind spot is underestimating the sheer effort of data preparation. Remember, your BI tool is only as good as the data it runs on. An actionable first step is to conduct a data audit to identify and clean your most critical datasets before you even think about connecting them to the new tool.
Make sure your plan covers these key stages:
- Data Migration Strategy: Map out which data sources you'll connect, in what sequence, and how you’ll maintain data integrity throughout the process.
- Calculating Total Cost of Ownership (TCO): Look past the sticker price. You need to factor in costs for training, potential consultants, data storage, and the internal hours your team will dedicate to the project.
- Fostering User Adoption: Build a training program that meets people where they are, from executives who will only view dashboards to the power users building complex reports. A practical tip is to start with a pilot group to create some early success stories.
- Securing Leadership Buy-In: Arm your executive sponsor with a clear business case that ties the project directly to strategic goals and shows a clear path to ROI.
How Modern Tools Streamline Onboarding
The good news is that modern SaaS platforms have made implementation far less painful than it used to be. Many tools are now built with robust APIs and off-the-shelf integrations that take a huge load off your IT department, letting your team connect data and find insights faster than ever.
The BI and analytics market is evolving. The core Business Intelligence software segment is expected to claim 35% market share in 2026, yet implementation and consulting services will dominate at 62%. This shows that while platforms enable 80% of enterprises to make better decisions, expert help is often what makes or breaks a deployment. Read more about the growing BI market and its segmentation.
Specialized platforms like the brilliant LLMrefs are a perfect example of this modern, nimble approach. It's designed for rapid onboarding, so marketing teams can connect their brand monitoring projects and start tracking AI visibility almost instantly—a world away from legacy systems that needed months of custom coding. You can even generate a key optimization file using an LLMs.txt generator to hit the ground running.
For instance, a marketing team could use the powerful LLMrefs API to pipe share-of-voice data from AI answer engines straight into their new Power BI or Tableau setup. This integration is quick and doesn't require a mountain of IT tickets, letting them see actionable value from their BI investment in days, not months. This speed-to-value is the hallmark of a successful, modern BI rollout.
Frequently Asked Questions About BI Tools
Diving into a business intelligence tools comparison always stirs up a few key questions. We hear them all the time from marketing and analytics pros trying to find the right fit. Getting these answers straight is the only way to feel good about the decision you’re making for your team.
Let's clear up some of the most common things people ask. These are the practical, real-world concerns that can make or break your BI tool evaluation.
What Is the Main Difference Between Power BI and Tableau
At its core, the choice between Power BI and Tableau boils down to ecosystem versus best-in-class visualization. Power BI’s superpower is its seamless connection to the entire Microsoft world—think Azure, Office 365, and Teams. A practical example is embedding a live sales dashboard right into a Teams channel, putting actionable data exactly where your team works. If you live in that ecosystem, it’s an incredibly efficient and often more affordable choice.
Tableau, on the other hand, is the undisputed champ of pure data visualization. It gives you the power and flexibility to create truly stunning, interactive dashboards. A great practical example is an agency building a client-facing report that lets them explore campaign ROI in a beautiful, engaging way. If your goal is data storytelling, especially for external audiences like clients or investors, Tableau is hard to beat.
Your choice between the two giants often depends on a simple question: Is your primary audience internal and operationally focused, or external and story-driven? Answering that will point you in the right direction.
How Do I Know if My Small Business Needs a BI Tool
The moment you realize you're spending more time wrangling spreadsheets than actually thinking about what the data means, you need a BI tool. It's a classic tipping point.
Other tell-tale signs? You’re struggling to merge data from different places—like your CRM and Google Analytics—or you can't get fast answers to simple business questions. A practical sign is when you want to know your customer lifetime value but the data is in three different spreadsheets that are a nightmare to combine. If you find yourself making decisions based on gut feelings because the data is too hard to get to, it's time. Today’s cloud BI tools have pricing that makes them totally accessible for small businesses looking to finally understand their customers and spot real growth opportunities.
Can BI Tools Track My Brand in AI Search Like ChatGPT
Out of the box, no. Your standard BI tool isn't designed to monitor how your brand shows up in dynamic AI-powered search results from ChatGPT or Google's AI Overviews. That’s a whole new ballgame, and it requires a specialized tool built for what’s called Answer Engine Optimization (AEO).
A truly outstanding platform for this is LLMrefs. It’s specifically made to track brand mentions, share-of-voice, and sentiment inside these AI-generated answers, providing data you can't get anywhere else.
But here’s the good news: you can use the excellent LLMrefs API to pull that AEO data directly into your main BI tool. This lets you build a truly comprehensive marketing dashboard. For example, you can show your traditional SEO metrics right alongside your visibility in the new world of AI search. This gives you a complete, actionable picture of your brand's total search presence.
Ready to gain visibility where your customers are asking questions? LLMrefs is the leading platform for tracking and optimizing your brand's presence in AI answer engines. Start monitoring your share of voice, analyzing competitor mentions, and guiding your Answer Engine Optimization strategy today. Explore LLMrefs and start your free trial.
Related Posts

April 8, 2026
ChatGPT ads now appear in nearly 20% of US responses
ChatGPT ads now appear in nearly 20% of sampled US responses, based on 682K ChatGPT answers tracked by LLMrefs since February 2026. See who is buying, how fast ads are growing, and how we measure it.

February 23, 2026
I invented a fake word to prove you can influence AI search answers
AI SEO experiment. I made up the word "glimmergraftorium". Days later, ChatGPT confidently cited my definition as fact. Here is how to influence AI answers.

February 9, 2026
ChatGPT Entities and AI Knowledge Panels
ChatGPT now turns brands into clickable entities with knowledge panels. Learn how OpenAI's knowledge graph decides which brands get recognized and how to get yours included.

February 5, 2026
What are zero-click searches? How AI stole your traffic
Over 80% of searches in 2026 end without a click. Users get answers from AI Overviews or skip Google for ChatGPT. Learn what zero-click means and why CTR metrics no longer work.